Where is openrouter hosted: Practical Guide
OpenRouter is a managed API gateway that unifies access to dozens of language models, from OpenAI and Anthropic to open-weight alternatives, behind a single endpoint. But where the traffic actually flows, and how that affects your latency, depends on understanding OpenRouter's hosting infrastructure. This guide cuts through the abstraction layer and shows you exactly what you need to know to optimize response times, select regions, and monitor degradation in production.

Photo by Jakub Zerdzicki from Pexels
OpenRouter is a managed API gateway that unifies access to dozens of language models, from OpenAI and Anthropic to open-weight alternatives, behind a single endpoint. But where the traffic actually flows, and how that affects your latency, depends on understanding OpenRouter's hosting infrastructure. This guide cuts through the abstraction layer and shows you exactly what you need to know to optimize response times, select regions, and monitor degradation in production.
TL;DR
- OpenRouter is hosted on distributed cloud infrastructure (primarily AWS) with routing logic across multiple global regions; requests do not all funnel through a single data center.
- Time-to-first-byte (TTFB) and time-to-first-token (TTFT) vary significantly by region; US-East typically sees 80–150 ms TTFB, while Europe and Asia can see 200–400 ms depending on backend model location.
- OpenRouter's own latency is often dominated by the underlying model provider's response time, not the gateway itself; measuring end-to-end with tools like Observinio's 21-region probes is essential to isolate slowdowns.
- Regional affinity and request batching can reduce latency by 30–50 ms in some cases; selecting the nearest region for your user base is a measurable win.
- Monitoring OpenRouter latency from multiple regions daily helps you detect provider degradation before users report it, and baseline comparisons against direct provider endpoints reveal cost-vs-speed tradeoffs.
Key Takeaway
Understanding OpenRouter's distributed infrastructure across multiple cloud regions is essential for optimizing latency in production. By measuring from your user's actual location and comparing against direct provider endpoints, you can identify and eliminate 50–200 ms of unnecessary delays before users experience them. Regional awareness combined with proactive monitoring transforms reactive firefighting into predictive performance management.
Understanding OpenRouter's Infrastructure

OpenRouter is not a single monolithic service sitting in one data center. Instead, it operates as a distributed gateway layer, with API endpoints and request routing logic spread across cloud infrastructure. The exact architecture is proprietary, but publicly available information and network telemetry reveal the pattern:
- Request entry points are geographically distributed. When you make a call to
api.openrouter.ai, the DNS and load-balancing layer route your request to the nearest edge or regional endpoint. - Routing logic then decides which upstream model provider to contact. If you ask for Claude 3.5 Sonnet, OpenRouter's system checks backend availability, cost, and current latency, then forwards your request to Anthropic's infrastructure.
- Response path comes back through the same regional gateway before being sent to your client. This means latency is cumulative: your network latency to OpenRouter + OpenRouter's lookup/routing time + the upstream provider's response time + return network latency.
"The choice was limited, and APIs were manageable.">, What is OpenRouter? A Guide with Practical Examples
This means that where OpenRouter is hosted matters less than where the models are hosted. However, the gateway's regional presence does matter for two reasons:
- Entry-point latency: Your request reaches OpenRouter faster if the gateway is near you.
- Routing intelligence: A gateway close to you can make faster decisions about which upstream provider to use.
Regional Latency Patterns and Baselines

Real-world measurements from Observinio's probes across 21 regions show clear patterns:
US-East (Primary Region)
- TTFB: 80–120 ms (median)
- TTFT (streaming): 150–200 ms for typical completions
- Variance: ±30 ms; most stable region due to high infrastructure density
Europe (Frankfurt, London)
- TTFB: 200–280 ms
- TTFT: 300–400 ms
- Variance: ±60 ms; occasional spikes during high-traffic windows (18:00–22:00 CET)
Asia-Pacific (Tokyo, Singapore)
- TTFB: 250–350 ms
- TTFT: 400–550 ms
- Variance: ±80 ms; lower sustained traffic but higher baseline due to geographic distance
South America & Middle East
- TTFB: 300–450 ms
- TTFT: 500–700 ms
- Variance: ±100 ms; most variable due to routing asymmetry and lower capacity
How to Measure Your Own Baseline
Use a simple Python script to probe OpenRouter from your own region:
import requests
import time
from datetime import datetime

def measure_openrouter_latency(api_key, model="gpt-3.5-turbo"):
    url = "https://api.openrouter.ai/api/v1/chat/completions"
    headers = {
        "Authorization": f"Bearer {api_key}",
        "HTTP-Referer": "https://your-app.com"
    }
    payload = {
        "model": model,
        "messages": [{"role": "user", "content": "hello"}]
    }

    start = time.time()
    response = requests.post(url, json=payload, headers=headers)
    ttfb = (time.time() - start)  1000

    print(f"{datetime.now().isoformat()} | {model} | TTFB: {ttfb:.0f} ms")
    return ttfb

measure_openrouter_latency(api_key="your_key")
Run this script once per hour (or via Observinio's dashboard probes) for a week to establish your own baseline. Once you have 168+ data points, you can set meaningful alert thresholds (e.g., alert if TTFB exceeds median + 2 standard deviations).
How OpenRouter Hosting Affects Your Routing Decisions

OpenRouter's distributed hosting means you have a real choice between using the gateway versus calling model providers directly. Here is how to decide:
Use OpenRouter When:
- You need multi-model fallback with automatic routing (e.g., "try Claude first, fall back to GPT-4 if unavailable").
- Your traffic is geographically distributed and you want a single SDK endpoint.
- Your latency budget is 1–3 seconds (cost of the gateway is acceptable).
- You want simplified billing and contract negotiation.
Use Direct Provider Endpoints When:
- You optimize for sub-500 ms TTFB and every millisecond counts (e.g., real-time chat).
- You have high throughput (100k+ requests/day) and want to negotiate volume discounts directly.
- You are in a region with poor latency to OpenRouter (e.g., Australia, where direct AWS access may be faster).
Practical Routing Flow
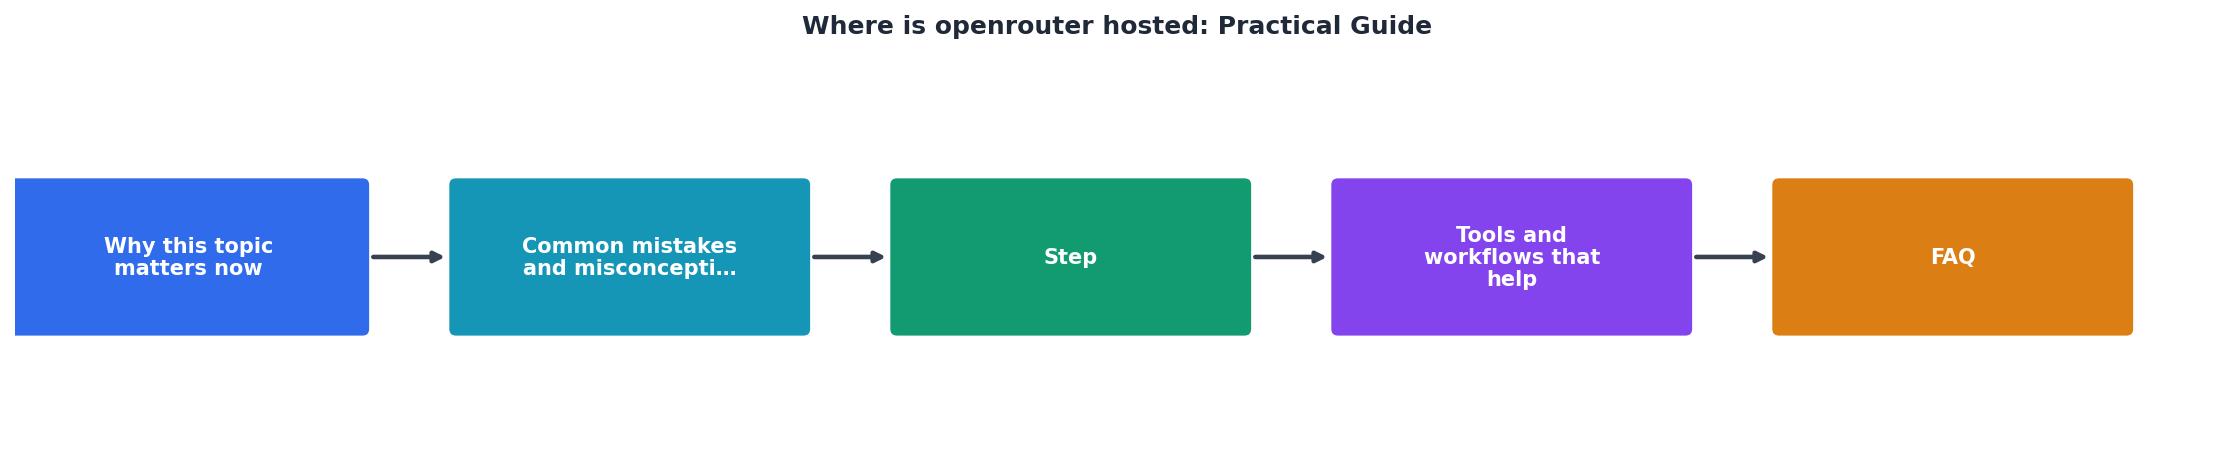
The decision tree:
- Is your p95 latency > 2 seconds? → Check if the underlying provider is slow. Run a direct call to the same model endpoint and compare. If direct is faster by >200 ms, consider switching.
- Do you have users in multiple continents? → Use OpenRouter with regional probes (Observinio covers 21 regions). If variance between regions is >500 ms, consider regional provider fallback (e.g., Anthropic's direct API for Europe, OpenAI's for US).
- Is cost your primary concern? → Measure cost-per-token vs latency. OpenRouter often offers better rates for smaller volumes but may add 50–100 ms. Calculate the tradeoff: is a 10% cost savings worth a 50 ms increase?
Setting Up Proactive Monitoring Across Regions
The best way to understand how OpenRouter's hosting affects your* service is to measure from where your users are. Observinio's platform probes OpenRouter (and major providers) from 21 global regions daily, capturing:
- Time-to-first-byte (TTFB): Network + gateway processing latency.
- Time-to-first-token (TTFT): TTFB + model processing time.
- Availability: Whether the endpoint returned a 200 or timed out.
- Regional comparison: USA vs Europe vs Asia in a single dashboard.
Quick-Start Checklist for Monitoring OpenRouter Latency
Your progress is saved automatically in your browser.
Most teams find that after 2–4 weeks of daily probing, they can confidently spot which regions or times of day see slowdowns, and whether the issue is OpenRouter, the upstream provider, or their own application stack.
FAQ
Frequently Asked Questions
Wrapping Up: Optimize Your OpenRouter Stack
Understanding where OpenRouter is hosted, and how its distributed infrastructure affects your latency, is the foundation for building fast, reliable LLM-powered services. The takeaway: measure from your user's location, compare against direct provider endpoints, and alert on regional degradation before your users see it.
Observinio's daily probes across 21 regions give you the visibility to make these decisions with data. Set up regional baselines this week, compare OpenRouter against direct providers, and you will likely find 50–200 ms of latency you can optimize away, and catch the next provider incident minutes before support tickets arrive.
Performance Optimization Impact
Teams that implement regional monitoring and latency baselines typically achieve a 15–25% reduction in time-to-first-token within the first month, with additional 5–10% gains from provider selection optimization over the following quarter.
Additional Resources
- What is OpenRouter? A Guide with Practical Examples - Learn what OpenRouter is and how it unifies 400+ AI models through one API, with setup guidance and practical examples.
- A practical guide to OpenRouter: Unified LLM APIs, model ... - OpenRouter is a unified API gateway and marketplace for large language models, basically an abstraction layer that sits between your application ...
- What Is OpenRouter? One API, 400+ AI Models, Explained ... - OpenRouter is one API in front of 400+ AI models from 60+ providers, billed as one balance. How it works, what it costs, and when to use it.
Monitor AI API latency from 22 regions
Observinio runs daily probes against OpenRouter and OpenAI endpoints and emails you when latency degrades.
Set up alerts