TTFT tracking setup for streaming endpoints
When your chat completion endpoint streams tokens via Server-Sent Events, the single most important latency number is not total response time, it is Time to First Token (TTFT). That is the gap between the moment your application sends the request and the moment the first usable token arrives at the client. A user staring at a blank chat bubble for 3 seconds will blame your product, not the upstream provider. This guide walks through exactly how to instrument TTFT as a standalone metric, wire it into alerts, and use regional baselines to catch degradation before your users do.

Photo by John Taran from Pexels
When your chat completion endpoint streams tokens via Server-Sent Events, the single most important latency number is not total response time, it is Time to First Token (TTFT). That is the gap between the moment your application sends the request and the moment the first usable token arrives at the client. A user staring at a blank chat bubble for 3 seconds will blame your product, not the upstream provider. This guide walks through exactly how to instrument TTFT as a standalone metric, wire it into alerts, and use regional baselines to catch degradation before your users do.
TL;DR
- TTFT measures the delay from request dispatch to the arrival of the first streamed token, it is the latency your users actually feel.
- Standard APM tools typically record only total request duration, which hides TTFT inside a much larger number.
- You need two timestamps per request: one at send, one at the first
data:line in the SSE stream. - Regional variance matters: a model that responds in 400 ms from
us-east-1may take 1 200 ms fromap-southeast-1. - Pair self-instrumented TTFT with external synthetic probes (like Observinio's 21-region checks) for a complete picture.
Why TTFT deserves its own metric
Most observability stacks treat an HTTP request as a single span. For a non-streaming POST /v1/chat/completions call that returns the full response in one payload, total duration and TTFT are effectively the same thing. The moment you flip "stream": true, they diverge dramatically. Total duration now includes every token generation step, potentially 5–30 seconds for a long answer, while TTFT might be only 300 ms. If you only track total duration, a perfectly healthy TTFT gets buried inside a noisy, high-variance metric.
Consider a concrete scenario: your model generates a 500-token response. Total duration is 8 seconds. TTFT is 450 ms. One day the provider's prefill stage degrades and TTFT jumps to 2 200 ms, but generation speed stays the same, so total duration moves to roughly 9.7 seconds, a 21 % increase that might not even fire a coarse alert. Meanwhile, every user now waits an extra 1.75 seconds before seeing anything on screen. That is the kind of regression that drives churn, and it is invisible without a dedicated TTFT metric.
"The differencelies in instrumenting TTFT as a distinct metric, separate from total-duration dashboards." >, AGENTPERF02
TTFT vs TTFB vs total duration
It helps to be precise about terminology:
- TTFB (Time to First Byte): The time until the first byte of the HTTP response arrives. For streaming endpoints this is usually the HTTP header or the first SSE comment line, not yet a usable token.
- TTFT (Time to First Token): The time until the first meaningful token appears in the stream. This is what the user perceives.
- Total duration: The time from request send to the final
data: [DONE]event.
data: {"choices":[]} keep-alive before real tokens flow, which can separate the two by hundreds of milliseconds. Always parse for the first non-empty content delta, not just the first byte.
How to instrument TTFT in your application code
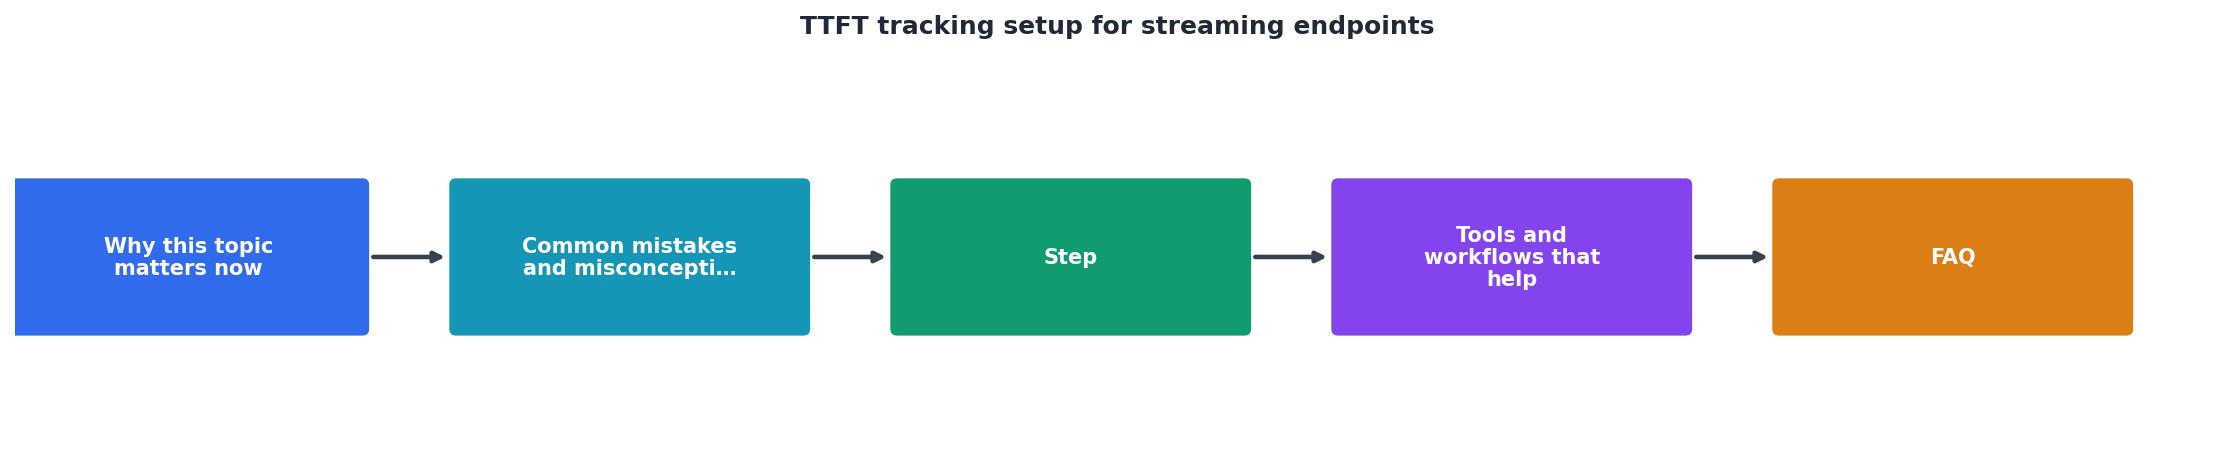
The core idea is simple: record a high-resolution timestamp right before you send the request, then record another the instant you parse the first token from the stream. The difference is your TTFT. Below is a step-by-step approach that works with any OpenAI-compatible streaming endpoint, including OpenRouter.
Step-by-step: Python with the OpenAI SDK
- Install dependencies. You need
openai>=1.0and a metrics library. Prometheus client or a simple StatsD sender both work.
- Wrap the streaming call. Capture
t_startimmediately beforeclient.chat.completions.create().
- Iterate the stream and capture
t_first_token. On the first chunk wherechunk.choices[0].delta.contentis non-empty, record the timestamp.
- Compute and emit the metric.
ttft = t_first_token - t_start. Push it to your metrics backend with labels for model, region, and provider.
- Continue consuming the stream normally. TTFT tracking should not alter your response-handling logic.
import time
from openai import OpenAI

client = OpenAI(
    base_url="https://openrouter.ai/api/v1",
    api_key="sk-or-...",
)

def stream_with_ttft(messages: list, model: str = "openai/gpt-4o") -> dict:
    """Stream a chat completion and return TTFT alongside the full response."""
    t_start = time.perf_counter()
    t_first_token = None
    collected_content = []

stream = client.chat.completions.create(
        model=model,
        messages=messages,
        stream=True,
    )

for chunk in stream:
        delta = chunk.choices[0].delta
        if delta.content:
            if t_first_token is None:
                t_first_token = time.perf_counter()
            collected_content.append(delta.content)

t_end = time.perf_counter()

ttft_ms = (t_first_token - t_start)  1000 if t_first_token else None
    total_ms = (t_end - t_start)  1000

# Emit to your metrics backend
    # e.g. statsd.timing("llm.ttft_ms", ttft_ms, tags=[f"model:{model}"])

return {
        "content": "".join(collected_content),
        "ttft_ms": round(ttft_ms, 1) if ttft_ms else None,
        "total_ms": round(total_ms, 1),
    }
Key details to note:
time.perf_counter()gives sub-millisecond resolution on all major platforms. Avoidtime.time(), its resolution varies by OS.- Check
delta.contenttruthiness, not justdelta. The first chunk often carries only arolefield with no content. - Label your metrics with model name and the region your server runs in. Without region labels, you cannot distinguish a provider-side regression from a network path issue.
Adapting for Node.js / TypeScript
The same pattern applies. Use performance.now() for high-resolution timing. With the openai npm package (v4+), iterate the async generator returned by stream: true and capture the timestamp on the first non-empty delta.content. Push the result to Prometheus, Datadog, or any StatsD-compatible collector.
Accounting for regional variance
TTFT is not a single number, it is a distribution that shifts depending on where the request originates. A request from Frankfurt to an OpenAI endpoint in the US East Coast adds roughly 80–100 ms of network round-trip time compared to a request from Virginia. When you route through OpenRouter, there is an additional hop through their proxy layer, which may or may not be co-located with the downstream provider.
This means you need baselines per region. A TTFT of 600 ms from eu-west-1 might be perfectly normal, while the same 600 ms from us-east-1 signals a serious prefill slowdown. Without per-region baselines, your alerts will either fire constantly for distant regions or miss real degradation in nearby ones.
Building regional baselines
- Identify your traffic regions. Check where your application servers or edge functions run. Most teams have 2–5 primary regions.
- Collect at least 7 days of TTFT data per region before setting alert thresholds. Weekday and weekend patterns can differ.
- Compute p50, p90, and p99 per region-model pair. Use p90 as your primary alert threshold, it catches degradation without firing on normal tail latency.
- Re-evaluate baselines monthly. Provider infrastructure changes, model updates, and routing adjustments all shift the distribution.
TTFT tracking checklist
Use this checklist to verify your setup is complete:
Your progress is saved automatically in your browser.
Common pitfalls
Even with the right timestamps in place, several issues can corrupt your TTFT data:
- Connection reuse vs cold connections. The first request on a new TCP/TLS connection includes handshake overhead. If your HTTP client pools connections, most requests benefit from warm connections, but the first request after an idle timeout will show inflated TTFT. Tag or filter these out.
- Client-side buffering. Some HTTP client libraries buffer the response body before yielding chunks. Ensure your client is configured for true streaming. In Python's
httpx, you needstream=Trueon the response and iteration viaresponse.aiter_lines(). - Proxy and load-balancer buffering. If your requests pass through an nginx reverse proxy or a cloud load balancer, response buffering can add latency that looks like provider-side TTFT. Set
proxy_buffering off;in nginx or use gRPC/WebSocket passthrough where possible. - Mixing models in one metric. Different models have vastly different TTFT profiles. A small model might respond in 150 ms while a large reasoning model takes 2 000 ms for the first token. Always segment by model.
FAQ
Frequently Asked Questions
Stay ahead of TTFT regressions
Instrumenting TTFT in your own code gives you visibility into what your users experience. Pairing that with external synthetic monitoring closes the loop, you can distinguish between problems in your stack and problems at the provider level. Observinio tracks TTFT and TTFB from 21 regions against OpenRouter and OpenAI endpoints daily, compares results against rolling baselines, and sends email alerts when degradation is detected. Check the status page for current latency data, or visit the OpenRouter provider page to see how TTFT varies across regions right now.
Observinio runs daily synthetic probes against OpenRouter and OpenAI endpoints, tracking TTFT and TTFB separately from every major cloud region. Get email alerts the moment latency drifts beyond your baselines.
View current latency data →Additional Resources
- AGENTPERF02-BP04 Optimize streaming responses and ... - You have TTFT tracked as a distinct KPI from end-to-end latency, with a target bounded by the interaction type. You have LLM output streamed to the user as it ...
- Measuring latency metrics like TTFT, TBT when depl... - Practical ways to capture TTFT and TBT the streaming loop on the client and optionally log metrics to MLflow. tracing in the agent code or ...
- DiSCo: Device-Server Collaborative LLM-Based Text ... - DiSCo uses cost-aware scheduling and token-level migration to dynamically optimize TTFT and TBT across device and server endpoints.
Monitor AI API latency from 22 regions
Observinio runs daily probes against OpenRouter and OpenAI endpoints and emails you when latency degrades.
Set up alerts