Status page copy templates for LLM dependencies
When an LLM provider degrades, the hardest part is rarely the technical fix, it is writing the status update that goes out to stakeholders, customers, and on-call engineers within minutes. A vague "we are experiencing issues" message erodes trust faster than the outage itself. Pre-written, latency-aware copy templates let you publish accurate, professional updates in under sixty seconds, even at 3 AM during an incident.

Photo by Artem Podrez from Pexels
When an LLM provider degrades, the hardest part is rarely the technical fix, it is writing the status update that goes out to stakeholders, customers, and on-call engineers within minutes. A vague "we are experiencing issues" message erodes trust faster than the outage itself. Pre-written, latency-aware copy templates let you publish accurate, professional updates in under sixty seconds, even at 3 AM during an incident.
TL;DR
- Status page copy for LLM dependencies must reference measurable metrics: TTFB, TTFT, and regional scope.
- Pre-drafted templates for five incident phases (investigating, identified, monitoring, resolved, post-incident) eliminate decision fatigue during outages.
- Templates should distinguish between provider-side degradation and your own infrastructure issues.
- Automated latency baselines, like those from Observinio's daily probes, give you concrete numbers to cite instead of guesses.
- A quarterly review cadence keeps templates aligned with your current provider stack and SLOs.
Why LLM dependencies need dedicated status copy
Most status page playbooks were designed for first-party services: your database, your CDN, your compute cluster. LLM API dependencies break that model in three ways:
- Opaque failure modes. A 20 % increase in TTFT from OpenAI or OpenRouter does not trigger a 5xx error. Your health checks pass, but users notice sluggish chat responses.
- Regional variance. A provider might be healthy in
us-east-1whileap-southeast-1sees 3× baseline latency. Generic copy like "our AI features are degraded" does not help a support team in Singapore triage tickets. - Shared responsibility confusion. Customers do not care whether the slowdown is in your routing layer or the upstream model. They want to know what is affected, how badly, and when it will be fixed.
Anatomy of a good LLM status update

A well-structured status update for an LLM dependency includes five elements:
- Component name, e.g., "AI Chat Completions (OpenRouter → Claude 3.5 Sonnet)".
- Impact scope, which regions, which endpoints, which user-facing features.
- Observed metric, "TTFB increased from 320 ms baseline to 1,400 ms in
eu-west-1." - Root cause attribution, provider-side, routing-side, or under investigation.
- Next update ETA, a concrete time, not "soon."
Metric language matters
Avoid subjective words like "slow" or "intermittent." Instead, anchor every statement to a number. If you use Observinio's daily probe data, you already have a regional baseline for each model endpoint. Reference it directly:
"Current TTFT for GPT-4o via OpenRouter in eu-central-1 is 2,100 ms. Our 7-day baseline for this region is 480 ms. This represents a 4.4× degradation."
That single sentence tells an on-call engineer everything they need to decide on a failover.
Five-phase copy templates
| Phase | Status label | Primary goal | Owner |
|---|---|---|---|
| 1 | Investigating | Acknowledge the anomaly and set expectations | On-call engineer |
| 2 | Identified | Confirm root cause and begin mitigation | On-call engineer |
| 3 | Monitoring | Verify that the fix is holding | On-call engineer |
| 4 | Resolved | Close the incident with a duration summary | Incident commander |
| 5 | Post-incident | Publish timeline, impact, and follow-up actions | Engineering lead |
Below are ready-to-use templates for each incident phase. Replace the bracketed placeholders with real values from your monitoring stack.
Phase 1, Investigating
Title: Elevated latency on [FEATURE NAME]
Status: Investigating
Time: [TIMESTAMP UTC]

We are investigating elevated response times for [FEATURE NAME]
powered by [PROVIDER / MODEL]. Observed TTFB in [REGION(S)] is
[CURRENT VALUE] ms against a baseline of [BASELINE VALUE] ms.

No user-facing errors have been confirmed yet. We are correlating
with upstream provider status and our own routing metrics.

Next update in [N] minutes.
Phase 2, Identified
Title: [PROVIDER] degradation affecting [FEATURE NAME]
Status: Identified
Time: [TIMESTAMP UTC]

Root cause has been identified as upstream latency degradation from
[PROVIDER] for the [MODEL] endpoint in [REGION(S)]. TTFT is
currently [CURRENT VALUE] ms ([X]× above baseline).

Affected features: [LIST].
Mitigation in progress: [ACTION, e.g., rerouting to fallback model /
region].

Next update in [N] minutes.
Phase 3, Monitoring
Title: [FEATURE NAME] latency improving, monitoring
Status: Monitoring
Time: [TIMESTAMP UTC]

Following [MITIGATION ACTION], TTFB in [REGION(S)] has decreased
from [PEAK VALUE] ms to [CURRENT VALUE] ms. Baseline is
[BASELINE VALUE] ms.

We are monitoring for stability over the next [N] minutes before
marking this resolved.
Phase 4, Resolved
Title: [FEATURE NAME] latency returned to normal
Status: Resolved
Time: [TIMESTAMP UTC]

TTFB across all affected regions is now within baseline thresholds.
The incident lasted [DURATION]. A post-incident review will be
published within [TIMEFRAME].
Phase 5, Post-incident summary
Title: Post-incident review, [DATE] [PROVIDER] latency event
Status: Post-incident
Summary: Between [START TIME] and [END TIME] UTC, [FEATURE NAME]
experienced degraded response times due to elevated latency from
[PROVIDER]'s [MODEL] endpoint in [REGION(S)].
Timeline:
- [T+0 min] Observinio alert triggered: TTFB in [REGION] exceeded
[THRESHOLD] ms.
- [T+N min] On-call confirmed upstream degradation; status page
updated.
- [T+N min] Traffic rerouted to [FALLBACK].
- [T+N min] Provider latency returned to baseline; rollback initiated.
- [T+N min] Incident resolved.
Impact: [X]% of requests in [REGION(S)] experienced >2× baseline
latency for [DURATION].
Follow-up actions:
- [ACTION ITEM]
- [ACTION ITEM]
Adapting templates for multi-provider stacks

If your product routes through OpenRouter and also calls OpenAI directly as a fallback, your status page needs to reflect that topology. Here is a practical checklist for multi-provider setups:
Your progress is saved automatically in your browser.
"This means that we can only include roughly 0.8% of the repository in Gemini 1.5 Flash's huge 500k token context.">, Medium
This quote highlights a broader truth about LLM integrations: context limits, token budgets, and model-specific constraints mean that each provider-model combination behaves differently under load. Your status copy must be specific enough to reflect which model, which provider, and which region is affected, generic language simply will not cut it when your engineering team needs to act fast.
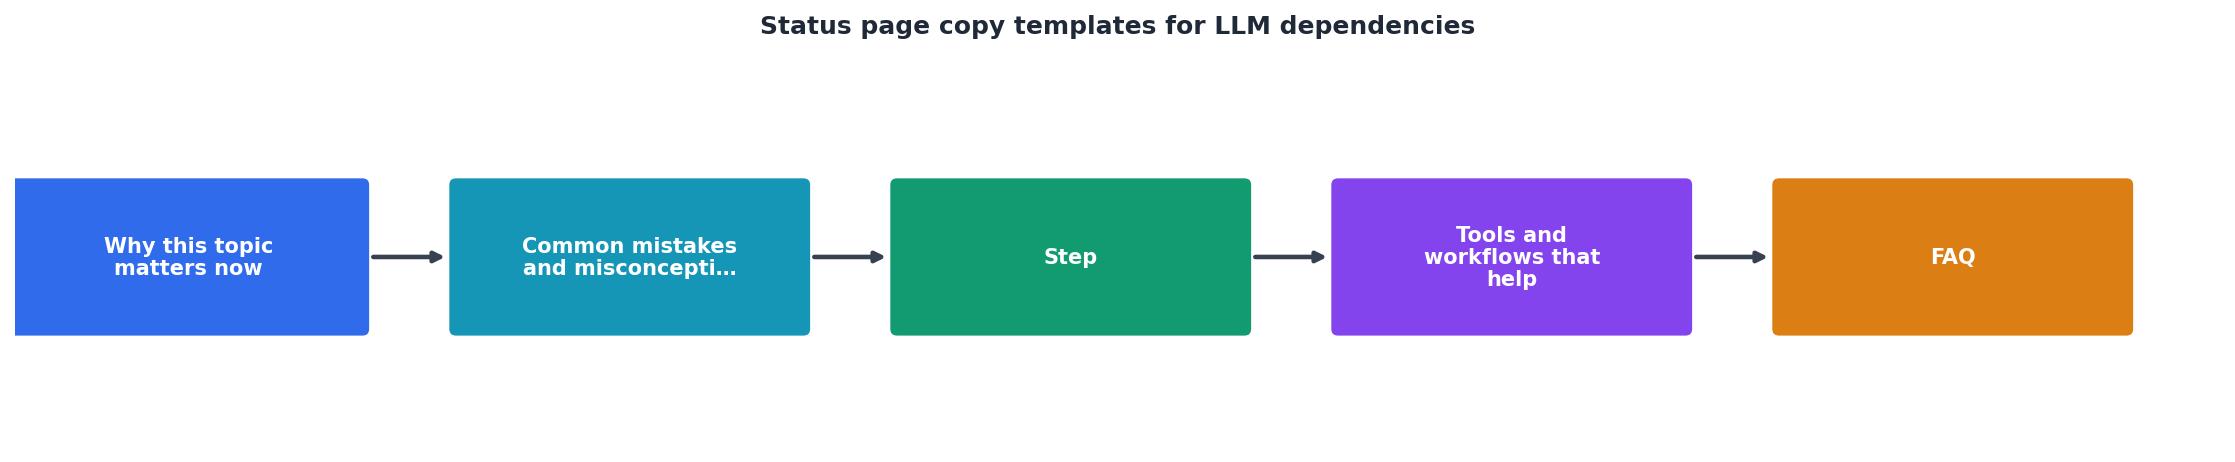
Step-by-step: setting up your template library
Follow these steps to go from zero to a production-ready template library in under an hour:
- Inventory your LLM dependencies. List every provider, model, and region your product uses. Include both primary and fallback paths.
- Pull baseline metrics. Export the last 30 days of TTFB and TTFT data from your monitoring tool. If you use Observinio, the weekly summary emails already contain regional baselines, copy them into a shared spreadsheet.
- Clone the five-phase templates above into your status page tool (Statuspage, Instatus, Cachet, or even a GitHub repo).
- Replace static placeholders with dynamic variables where your tool supports them. For example, Statuspage allows component-level metadata that can auto-populate region and component names.
- Wire alerts to template selection. When Observinio sends a degradation alert for a specific region and provider, your runbook should point the on-call engineer to the matching Phase 1 template with pre-filled values.
- Run a tabletop drill. Simulate a 3× TTFB spike in
ap-northeast-1for your primary model. Time how long it takes the on-call to publish Phase 1 and Phase 2 updates. Target: under 5 minutes total.
- Schedule quarterly reviews. Every quarter, diff your template library against your current provider stack. Remove deprecated models, add new regions, and update baseline numbers from the latest Observinio data.
Common mistakes to avoid
Even with templates, teams make predictable errors during LLM-related incidents:
- Blaming the provider too early. Until you have correlated your own routing metrics with upstream data, use "under investigation" language. Premature attribution can damage vendor relationships and mislead customers if the root cause turns out to be your own infrastructure.
- Omitting regional scope. Saying "AI features are degraded" when only
sa-east-1is affected causes unnecessary panic for users in healthy regions. Always specify geography. - Forgetting the next-update ETA. A status update without a follow-up time is an open wound. Commit to a concrete interval, 15 or 30 minutes, and honor it even if the update is "no change."
- Skipping the post-incident review. The Phase 5 template exists for a reason. Publishing a timeline with real latency numbers builds long-term credibility and gives your team actionable follow-ups.
Frequently Asked Questions
us-east-1 and your probes show 800 ms or higher for five consecutive minutes, that warrants a Phase 1 update. Adjust the multiplier based on your SLOs and user sensitivity.Start monitoring before the next incident
Templates are only as good as the data behind them. If you do not have regional latency baselines for your LLM providers, every placeholder in these templates becomes a guess. Observinio runs daily probes against OpenRouter and OpenAI endpoints from 21 regions, compares results against rolling baselines, and sends email alerts when degradation crosses your thresholds. Set up alerts once, and the next time you reach for a Phase 1 template, the numbers will already be in your inbox.
Additional Resources
- How to generate accurate LLM responses on large code ... - LLM would have to know about a huge web of intricate inner workings and dependencies to create a useful code snippet? being copied into the ...
- Served Domains, Maintenance, and Practitioner Guidelines - First, we mine and categorize templates to analyze the domains they serve, exploring the LLM-as-a-judge strategy. Next, we explore the ...
- How I Built a Tool to Auto-Generate GitHub Documentation ... - In this tutorial, I'll show you how I solved my own documentation challenges by creating a Spring Boot application that works with LLMs. ...
Monitor AI API latency from 22 regions
Observinio runs daily probes against OpenRouter and OpenAI endpoints and emails you when latency degrades.
Set up alerts