Serverless cold start measurement guide
When an LLM API request hits a serverless function that hasn't been invoked in several minutes, the cloud provider must initialize the runtime environment, load your code, and execute it, before your actual business logic runs. That initialization delay is a cold start, and for latency-sensitive AI workloads, it can mean the difference between a snappy chat interface and a frustrating user experience.

Photo by Nikolay Danilov from Pexels
When an LLM API request hits a serverless function that hasn't been invoked in several minutes, the cloud provider must initialize the runtime environment, load your code, and execute it, before your actual business logic runs. That initialization delay is a cold start, and for latency-sensitive AI workloads, it can mean the difference between a snappy chat interface and a frustrating user experience.
Cold starts are invisible in aggregate dashboards but lethal to user perception. A production AI system that consistently serves TTFB (time to first byte) under 200 ms might spike to 800 ms during a cold start, destroying your SLO. This guide shows you how to measure, quantify, and optimize cold starts in your serverless AI stack, using concrete metrics and actionable monitoring strategies.
TL;DR
- Cold starts add 100–800 ms of latency, depending on runtime, memory allocation, and code size; they hit randomly when functions haven't been invoked for ~5–15 minutes.
- Measure cold starts by instrumenting function initialization time, tracking invocation context, and comparing TTFB distributions across warm and cold calls.
- Regional variance amplifies cold start impact: a cold start in São Paulo may hit 600 ms while the same function in us-east-1 stays under 300 ms.
- Mitigation strategies include provisioned concurrency, language choice, dependency optimization, and container image tuning.
- Use synthetic probes from multiple regions to catch cold start degradation before users do; Observinio alerts on latency spikes that correlate with cold starts.
Key takeaway: Cold starts are unpredictable latency spikes that degrade user experience in AI workloads. Effective measurement via function instrumentation and regional synthetic probes is the first step toward consistent sub-300 ms time-to-first-byte performance, regardless of geography or traffic patterns.
Why Cold Starts Matter for AI APIs

A cold start is not a binary event, it's a latency tax applied to your first request after a period of inactivity. For serverless platforms like AWS Lambda, Google Cloud Functions, or Azure Functions, inactivity triggers function recycling. When the next request arrives, the platform must:
- Provision a new container or sandbox.
- Load the runtime environment (Python, Node.js, Go, etc.).
- Download and parse your function code.
- Execute any module-level imports and initialization.
- Connect to external services (database, API endpoints, model servers).
- Finally, invoke your handler.
For AI workloads, this matters acutely:
- Chat interfaces expect TTFB under 300 ms; a cold start pushes that to 1+ second, breaking user expectations.
- Batch inference tolerates higher latency, but cold starts still erode cost efficiency if you're paying per-millisecond.
- Regional deployment amplifies the problem: a function in eu-west-1 cold-starting might take 200 ms, but the same function in ap-southeast-1 cold-starting could take 800 ms due to slower I/O and network hops.
"The customer success story from Smartsheet demonstrates significant improvement in user experience with reduced latencies and better cost efficiency.">, Understanding and Remediating Cold Starts: An AWS Lambda Perspective
Cold starts are also unpredictable. They're not constant overhead, they depend on provider load, function idle time, and traffic patterns. This unpredictability breaks SLO reliability and complicates capacity planning.
Measuring Cold Starts: The Core Metrics

To optimize cold starts, you must first measure them. Measurement requires instrumenting three layers:
Layer 1: Function-Level Instrumentation
Inside your serverless function, track when initialization starts and when your handler runs. Most cloud providers expose this via context metadata.
For AWS Lambda, the context.getRemainingTimeInMillis() function tells you execution budget. By comparing elapsed time at key checkpoints, you can isolate cold start duration:
import time
import json

INIT_TIME = time.time()

def lambda_handler(event, context):
    handler_start = time.time()
    cold_start_ms = (handler_start - INIT_TIME)  1000

    # Log cold start if > 100 ms (threshold for your runtime)
    if cold_start_ms > 100:
        print(f"COLD_START_DETECTED: {cold_start_ms:.2f}ms")

    # Your business logic here
    response = call_llm_api(event)

    return {
        "statusCode": 200,
        "body": json.dumps(response),
        "cold_start_ms": cold_start_ms
    }
For Google Cloud Functions, use the FUNCTION_SIGNATURE_TYPE environment variable and log execution start time:
import time
import functions_framework

INIT_TIME = time.time()

@functions_framework.http
def measure_cold_start(request):
    handler_start = time.time()
    cold_start_ms = (handler_start - INIT_TIME)  1000

    return {
        "cold_start_ms": cold_start_ms,
        "result": "..."
    }
Layer 2: Request-Level Telemetry
Cold starts correlate with invocation patterns. Track:
- Time since last invocation: Use CloudWatch Logs or Cloud Logging to correlate cold start occurrence with idle periods.
- Memory allocation: Cold starts are faster at higher memory tiers (more CPU, faster initialization).
- Concurrent invocations: If your function receives 10 parallel requests after idle time, all 10 may cold-start (each on a separate container instance).
{
  "request_id": "req-12345",
  "timestamp": "2025-09-03T14:22:15Z",
  "cold_start_ms": 320,
  "ttfb_ms": 180,
  "ttft_ms": 450,
  "total_ms": 2100,
  "region": "us-east-1",
  "model": "gpt-4o",
  "provider": "openai"
}
Layer 3: Distributed Measurement Across Regions
Cold start latency varies dramatically by region. A function in us-east-1 might cold-start in 150 ms, but the same code in ap-northeast-1 might cold-start in 600 ms due to storage proximity, network hops, and provider infrastructure density.
Use synthetic probes from Observinio's 21 regions to invoke your functions and capture cold start timing:
- Daily probes from each region to simulate real user traffic and detect cold starts before production traffic hits.
- Baseline comparison to distinguish cold start latency from provider API latency.
- Degradation alerts when cold starts exceed your SLO threshold (e.g., "alert if TTFB > 400 ms").
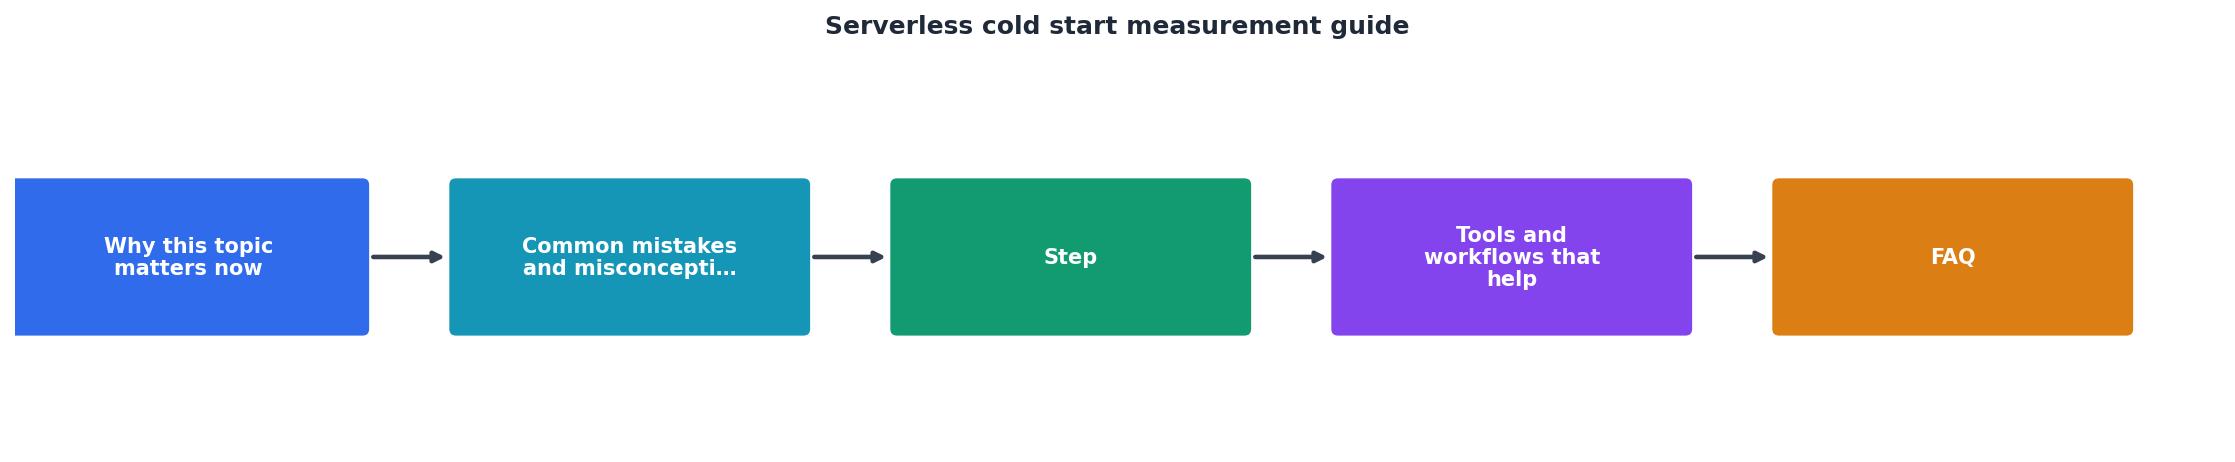
Step-by-Step: Implementing Cold Start Measurement

Process Overview
Implementation Checklist
Your progress is saved automatically in your browser.
Cold Start Optimization Strategies
Measurement reveals the problem; optimization reduces it. Common mitigation strategies:
Provisioned Concurrency
AWS Lambda's provisioned concurrency keeps a specified number of function instances "warm" (initialized and ready). Trade-off: you pay for idle time, but eliminate cold starts for predictable traffic.
When to use: Chat APIs, real-time dashboards, any sub-500 ms SLO.
Language and Runtime Selection
Cold start duration varies by runtime:
- Node.js 20.x: ~100–150 ms cold start (fastest).
- Python 3.12: ~150–250 ms cold start (moderate).
- Java 21: ~800–1500 ms cold start (slowest, but improved with newer versions).
- Go: ~50–100 ms cold start (compiled, fastest after Node.js).
Dependency Optimization
Every import adds cold start overhead. Audit your dependencies:
- Remove unused packages from
requirements.txtorpackage.json. - Use lazy loading: import heavy libraries inside handlers, not at module level.
- Replace large monolithic libraries with lightweight alternatives (e.g.,
requests→httpxfor fewer transitive deps).
Container Image Tuning
For container-based serverless (Google Cloud Run, AWS Lambda with container images), optimize image size and layer structure:
- Use minimal base images (
python:3.12-slim, notpython:3.12). - Separate build dependencies from runtime dependencies.
- Cache layer ordering: put frequently-changing code last.
Regional Failover and Routing
Deploy functions in multiple regions and route requests intelligently:
- If us-east-1 cold-starts at 150 ms and eu-west-1 at 300 ms, route traffic to us-east-1 until eu-west-1 warms up.
- Use Observinio alerts to detect regional degradation and adjust routing rules.
FAQ
Frequently Asked Questions
(cold_start_cost - provisioned_cost) > 0 over your usage period.Recommended Cold Start Monitoring Stack
Observinio Integration Workflow
- Daily probes: Invoke your serverless function from 21 regions at fixed intervals to capture cold start baselines and detect anomalies.
- Latency aggregation: Collect TTFB distributions across regions and time windows to identify regional cold start patterns and provider-level variance.
- Alert routing: Trigger alerts when cold start duration exceeds regional p99 baseline, with automatic routing to your on-call rotation via PagerDuty or Slack.
- Trend analysis: Generate weekly reports showing cold start frequency, regional variance, and cost impact to justify optimization investments.
Next Steps
Cold start measurement is the foundation of a resilient AI backend. Start with function-level instrumentation (add 3 lines of code to log initialization time), then layer in regional synthetic probes to see how cold starts affect real users globally.
If cold starts consistently breach your SLO, evaluate provisioned concurrency, language selection, and dependency pruning. Use Observinio to monitor regional cold start variance and set up alerts for degradation, so you catch cold start issues before they degrade user experience.
For help configuring alerts or integrating cold start metrics with your observability stack, reach out via the contact page or check the status dashboard to ensure your monitoring infrastructure is online. By implementing these measurement and alerting strategies today, you will prevent cold start latency from undermining your AI service's performance tomorrow.
Additional Resources
- Understanding and Remediating Cold Starts - Cold starts occur because serverless platforms like AWS Lambda are designed for cost-efficiency – when your code isn't running. To optimize ...
- Serverless: Cold Start War - In the following sections, you will see charts that represent statistical distribution of cold start time as measured during my experiments.
- What is Cold Start? Understanding Serverless Latency - In the context of serverless computing, a “cold start” refers to the first-time latency or the time it takes for a function to begin ...
Monitor AI API latency from 22 regions
Observinio runs daily probes against OpenRouter and OpenAI endpoints and emails you when latency degrades.
Set up alerts