OpenRouter latency probe configuration checklist
A single aggregate latency number tells you almost nothing when your users span Tokyo, Frankfurt, and São Paulo. Configuring latency probes correctly, before you ship to production, is the difference between catching a 400 ms TTFB regression at 3 AM and learning about it from an angry Slack thread at 9 AM. This checklist walks you through every decision you need to make when setting up OpenRouter latency probes, from region selection to alert thresholds to ongoing maintenance.

A single aggregate latency number tells you almost nothing when your users span Tokyo, Frankfurt, and São Paulo. Configuring latency probes correctly, before you ship to production, is the difference between catching a 400 ms TTFB regression at 3 AM and learning about it from an angry Slack thread at 9 AM. This checklist walks you through every decision you need to make when setting up OpenRouter latency probes, from region selection to alert thresholds to ongoing maintenance.
TL;DR
- Choose probe regions that mirror your actual user traffic, not just
us-east-1. - Measure TTFB and TTFT separately, they reveal different failure modes.
- Set alert thresholds relative to your per-region baseline, not a single global number.
- Schedule probes at consistent intervals (every 5–15 minutes) to build reliable trend data.
- Use Observinio's 21-region probe network and weekly summaries to avoid building this infrastructure yourself.
Why dedicated latency probes matter for OpenRouter

OpenRouter acts as a routing layer between your application and dozens of upstream model providers. That extra hop introduces latency variance that does not exist when you call a provider directly. Worse, the variance is not uniform: a request routed to a provider with capacity in Virginia will behave very differently for a user in Singapore than for one in New York.
Without synthetic probes running from multiple geographic points, you are blind to three critical signals:
- Regional routing shifts. OpenRouter may change which upstream provider serves a given model. A probe in
eu-west-1will catch a Frankfurt-to-Virginia reroute that adds 120 ms overnight. - Provider-side degradation. Upstream models experience load spikes, cold starts, and capacity limits. Probes that fire every few minutes create a continuous signal you can correlate with incident timelines.
- Baseline drift. Latency creeps up gradually, 2 ms per week, until one day your P95 is 300 ms higher than it was a month ago. Trend data from consistent probes makes drift visible before it becomes a production problem.
Step-by-step probe configuration checklist
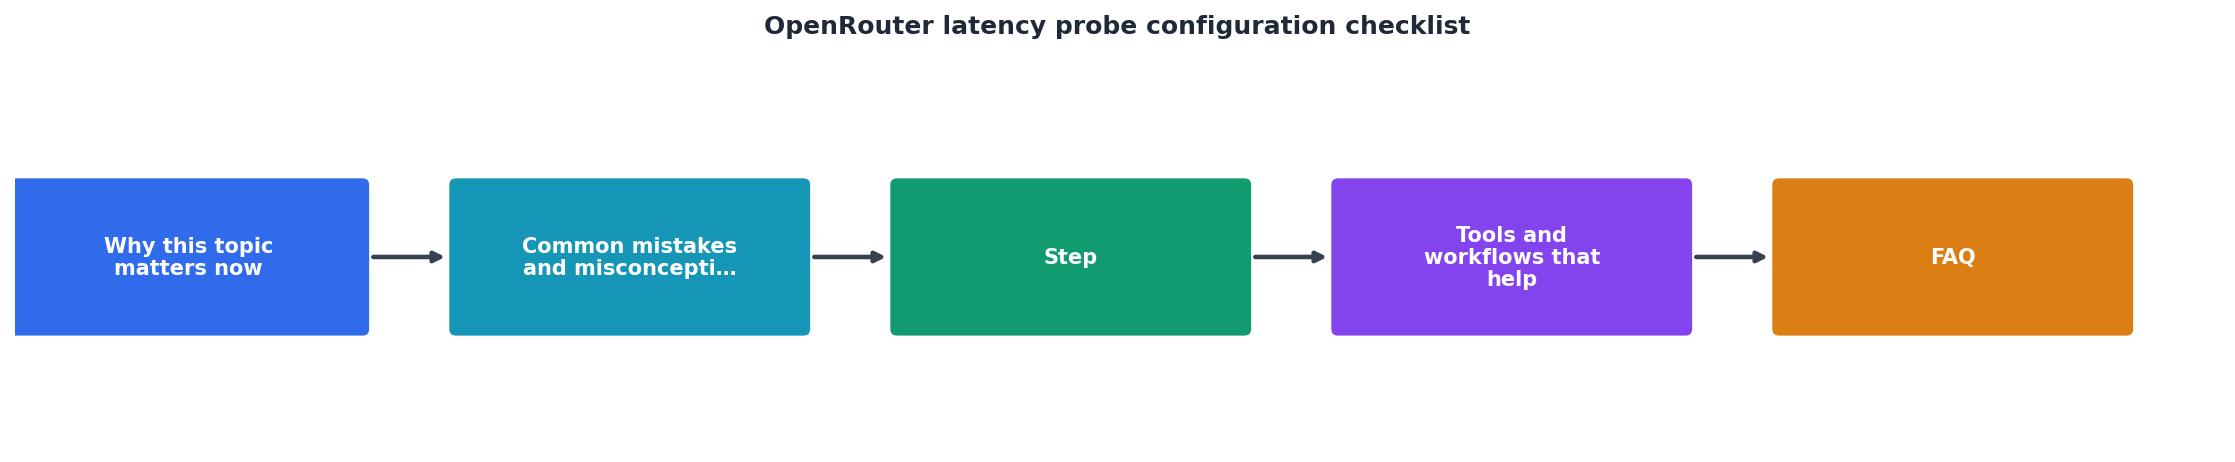
Follow these steps in order. Each one builds on the previous decision.
Step 1: Inventory your models and endpoints
List every OpenRouter model your application calls in production. For each model, note:
- The model identifier (e.g.,
openai/gpt-4o,anthropic/claude-3.5-sonnet). - Whether you use streaming or non-streaming completions.
- The typical prompt size (token count) and max completion length.
gpt-4o with streaming enabled will produce different TTFB and TTFT numbers than a non-streaming call to claude-3.5-sonnet with a 2 000-token prompt.
Step 2: Select probe regions
Map your user base to cloud regions. If 40 % of your traffic originates in Western Europe, you need probes in at least two European regions (e.g., Frankfurt and London). If you serve Asia-Pacific, add Tokyo and Sydney at minimum.
A practical starting set for most global applications:
- North America:
us-east-1(Virginia),us-west-2(Oregon) - Europe:
eu-central-1(Frankfurt),eu-west-2(London) - Asia-Pacific:
ap-northeast-1(Tokyo),ap-southeast-2(Sydney) - South America:
sa-east-1(São Paulo)
Step 3: Define probe payloads

Your probe payload should be deterministic and representative. Avoid random prompts, they make it impossible to compare results across runs. A good probe payload:
- Uses a fixed system message and user message.
- Requests a short completion (
max_tokens: 10–50) to minimize cost while still measuring TTFB and TTFT. - Sets
temperature: 0to reduce output variance.
{
  "model": "openai/gpt-4o",
  "messages": [
    {"role": "system", "content": "Reply with exactly one word."},
    {"role": "user", "content": "Say hello."}
  ],
  "max_tokens": 10,
  "temperature": 0,
  "stream": true
}
When streaming is enabled, record two timestamps: the moment the first byte arrives (TTFB) and the moment the first token is fully decoded (TTFT). These two metrics expose different bottlenecks, network latency versus model inference startup time.
"Documentation IndexFetch the complete documentation index at: /docs/llms.txtUse this file to discover all available pages before exploring further.">, Latency and Performance
Step 4: Set probe frequency
A probe interval of 5 minutes gives you 288 data points per day per region, enough to detect a 15-minute degradation window without excessive API spend. If cost is a concern, 15-minute intervals still produce 96 daily data points, which is sufficient for trend analysis and daily baseline comparison.
Avoid intervals shorter than 2 minutes unless you are actively investigating an incident. High-frequency probes can trigger rate limits on the OpenRouter API and skew your results.
Step 5: Establish baselines
Run your probes for at least seven full days before setting alert thresholds. This captures weekday/weekend variance, provider maintenance windows, and typical daily load patterns. Calculate per-region, per-model baselines for:
- Median (P50): Your "normal" latency.
- P95: The upper bound of acceptable performance.
- P99: The threshold where user experience visibly degrades.
Step 6: Configure alert thresholds
Set thresholds relative to your baselines, not absolute numbers. A good starting point:
| Severity | Condition | Example (if P50 baseline = 320 ms) |
|---|---|---|
| Warning | P50 exceeds baseline by 30 % for 3 consecutive probes | P50 > 416 ms for 15 min |
| Critical | P95 exceeds baseline by 50 % for 2 consecutive probes | P95 > 720 ms for 10 min |
| Emergency | Any probe returns a timeout or 5xx error twice in a row | Two consecutive failures |
Step 7: Validate and iterate
After your first week of live probes:
- Review alert history. If you received more than two false alarms per region, widen your thresholds by 10 %.
- Check for blind spots. If a region shows flat latency with zero variance, your probe payload may be cached or the region may not be routing to the expected provider.
- Compare probe data against real user latency from your application metrics. If the two diverge significantly, adjust your probe payload to better match production traffic patterns.
Ongoing maintenance checklist
Use this checklist monthly to keep your probe configuration healthy:
Your progress is saved automatically in your browser.
Frequently Asked Questions
openai/gpt-4o-mini for probes reduces cost further without sacrificing latency signal quality.Observinio monitors OpenRouter and OpenAI from 21 regions with automated baselines and alerting. View live latency data or contact us to start receiving weekly reports for your team.
Start monitoring before the next incident
Configuring latency probes is a one-time investment that pays off every time a provider degrades. If you would rather skip the infrastructure work, Observinio runs daily probes from 21 regions against OpenRouter and OpenAI endpoints, compares results to rolling baselines, and sends you email alerts when latency crosses your thresholds. Check the status page to see live data, or visit the contact page to set up alerts for your team.
Additional Resources
- Latency and Performance | Minimizing Gateway ... - Recommended minimum balance: $10-20 to ensure smooth operation. Use Provider Preferences. If you have specific latency requirements (whether time to first ...
- Provider Routing - Smart Multi-Provider Request ... - You can set minimum throughput or maximum latency thresholds to filter endpoints. OpenRouter tracks latency and throughput metrics for each model and provider
- OpenRouter Observability: Trace LLM Requests - This guide walks you through setting up OpenRouter monitoring using OpenTelemetry and exporting traces to SigNoz, so you can track requests, ...
Monitor AI API latency from 22 regions
Observinio runs daily probes against OpenRouter and OpenAI endpoints and emails you when latency degrades.
Set up alerts