Openrouter, inc.: Practical Guide
OpenRouter has emerged as a critical abstraction layer for teams deploying LLM APIs at scale. By routing requests across multiple model providers (OpenAI, Anthropic, Mistral, and others) from a single endpoint, it simplifies vendor management and enables cost-optimized inference. But like any external dependency in production, OpenRouter introduces latency variability that can degrade user experience if left unmonitored.

Photo by Isaac Taylor from Pexels
OpenRouter has emerged as a critical abstraction layer for teams deploying LLM APIs at scale. By routing requests across multiple model providers (OpenAI, Anthropic, Mistral, and others) from a single endpoint, it simplifies vendor management and enables cost-optimized inference. But like any external dependency in production, OpenRouter introduces latency variability that can degrade user experience if left unmonitored.
This guide walks through setting up reliable latency monitoring for OpenRouter, comparing performance across regions, and configuring alerts that keep your team ahead of degradation events.
TL;DR
- OpenRouter consolidates multiple LLM providers under one API; latency depends on provider choice, region, and routing logic.
- Use synthetic probes from 21+ global regions to measure Time-to-First-Byte (TTFB) and compare against your baseline SLO.
- Regional variance is real: a model that responds in 200 ms from US-East may take 450 ms from Singapore; set per-region thresholds.
- Email alerts tied to degradation events prevent support tickets from being your first warning sign.
- Weekly latency trend reports help teams defend provider decisions and spot long-term regression patterns.
Why OpenRouter Latency Matters

OpenRouter acts as a router between your application and multiple LLM providers. When your backend sends a completion request to api.openrouter.ai, the following happens:
- OpenRouter receives your request and applies any routing rules (fallback logic, load balancing, cost thresholds).
- The request is forwarded to the selected provider (e.g., OpenAI, Anthropic).
- The provider processes and returns the completion.
- OpenRouter relays the response back to your application.
"The choice was limited, and APIs were manageable.">, What is OpenRouter? A Guide with Practical Examples
This simplicity of choice is effective, but it assumes you have visibility into which regions are fast and which are not. Most teams discover regional slowness only after complaints arrive.
Setting Up Regional Latency Baselines

Baseline measurement is your foundation. You cannot alert on degradation without knowing what normal looks like.
Measurement points
Establish synthetic probes from at least 6–10 global regions covering your user distribution:
- US East (N. Virginia): your primary region; often has lowest latency to OpenRouter's US infrastructure.
- US West (Oregon or California): tests cross-country routing and failover.
- EU West (Ireland or Frankfurt): critical if serving European users; latency here often 150–250 ms higher than US.
- Asia Pacific (Singapore, Tokyo, Sydney): highest variance; can see 300+ ms swings week-to-week.
- Canada (Toronto) and Brazil (São Paulo): measure reliability in secondary markets.
- Total response time: complete response arrival.
- Provider latency (if logged): some OpenRouter logs include provider-side processing time.
Your progress is saved automatically in your browser.
Configuring Alerts and Thresholds

Once you have baselines, set per-region degradation thresholds. A simple rule:
Alert when regional p95 TTFB exceeds baseline median + 100 ms for 3 consecutive probe runs.
This catches genuine problems (provider slowdown, routing issues) while avoiding false positives from normal variance.
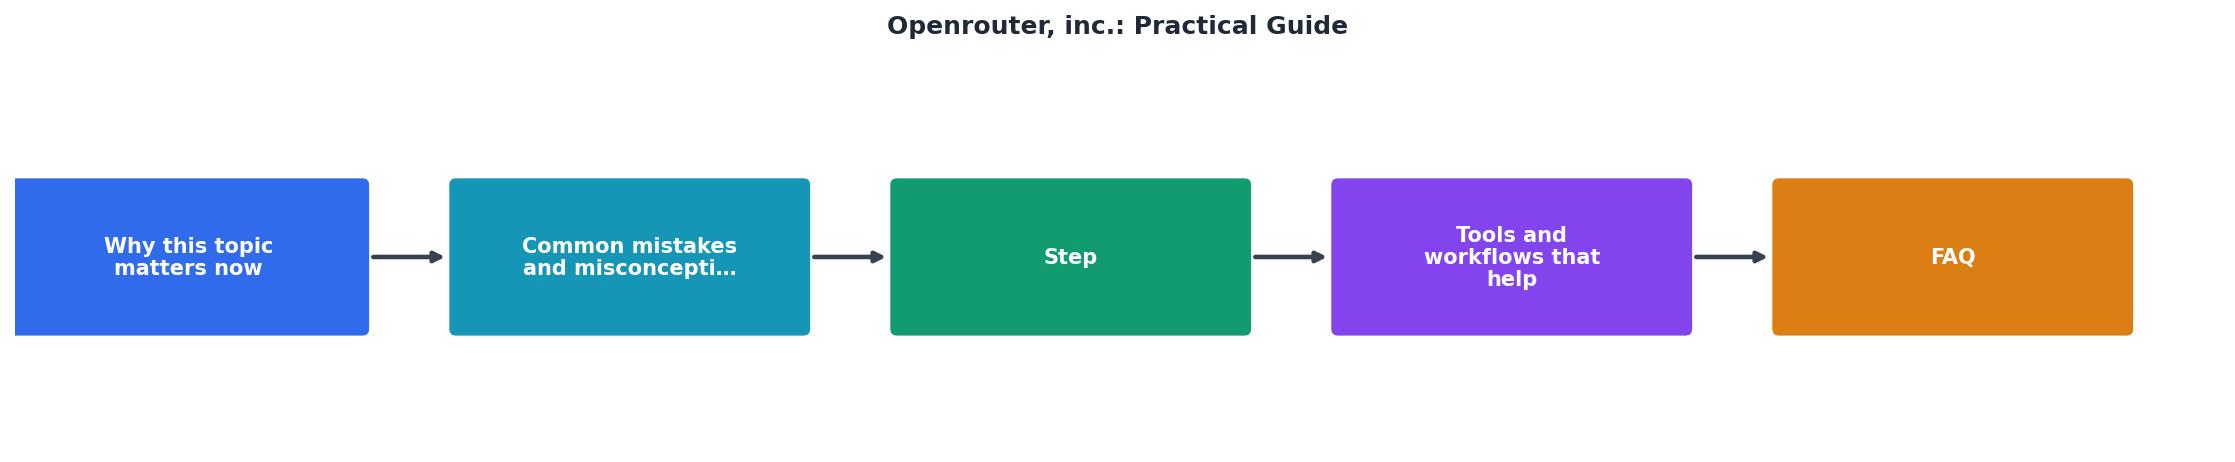
Alert Configuration Step-by-Step
- Pick your alerting tool: Email, Slack, PagerDuty, or native monitoring dashboards (Datadog, New Relic, etc.).
- Define the alert condition:
- If US-East p95 TTFB > 400 ms for 3 probes in a row, fire alert.
- If EU-West p95 TTFB > 600 ms for 3 probes in a row, fire alert.
- If APAC p95 TTFB > 900 ms for 3 probes in a row, fire alert.
- Exclude maintenance windows: OpenRouter or providers may publish scheduled maintenance; skip alerts during those windows.
- Route to on-call: For production services, send alerts to your on-call channel with region name, current p95, and baseline for quick assessment.
- Include a runbook: Alert message should link to a brief playbook: "TTFB high in region X. Check OpenRouter status page. If green, check provider docs for known issues. If persists >15 min, escalate to provider support."
Observinio-specific setup
Observinio's daily probes from 21 regions and email alerts are purpose-built for this. To set up:
- Navigate to
/providers/openrouterand create probes for your target regions. - Configure email alerts tied to degradation events (available under settings).
- Export weekly trend reports to spot long-term regressions.
- Use the comparison view to measure OpenRouter latency against direct OpenAI or Anthropic endpoints from the same region.
Comparing OpenRouter vs. Direct Provider Endpoints
A common question: Is OpenRouter's latency tax worth the routing flexibility? Real data beats opinion.
Comparison approach
Set up parallel probes: one hitting api.openrouter.ai/openai/gpt-4-turbo and another hitting api.openai.com/chat/completions (using the same model, same request), both from the same region and time window.
Compare TTFB and total latency over 5–10 days. Typically you will see:
- US regions: OpenRouter adds 20–50 ms due to routing + relaying.
- EU regions: OpenRouter adds 30–80 ms; provider variance is high here.
- APAC regions: OpenRouter adds 50–150 ms; routing overhead is more visible due to longer absolute latencies.
Your progress is saved automatically in your browser.
Handling Regional Hotspots and Failover
Some regions consistently run hot. Singapore, for example, often shows higher latency due to distance from US-hosted inference servers and local provider availability. This is normal, not a sign of an outage.
Regional hotspot strategy
- Accept the baseline: If Singapore always runs 600+ ms TTFB but is consistent, set your SLO to 700 ms for that region. Do not treat 650 ms as degradation.
- Set region-specific thresholds: Different regions get different alert thresholds based on their natural performance profile.
- Implement client-side fallback: For user-facing features, if latency from the user's nearest region exceeds 1000 ms, fall back to a cached or pre-computed response, or switch to a faster (but smaller) model.
- Route traffic strategically: Use OpenRouter's routing rules to prefer low-latency providers in high-variance regions. For APAC, Anthropic sometimes runs faster than OpenAI; log this and bias routing accordingly.
Weekly Review and Trend Analysis
Latency trends reveal patterns that one-off alerts miss. A provider that increases latency by 5 ms per week across all regions is degrading, but each week's data looks normal.
Your progress is saved automatically in your browser.
Observinio generates weekly trend reports automatically; subscribe to them at /status to stay informed without manual aggregation.
Practical Monitoring Code Snippet
Below is a minimal Python snippet to probe OpenRouter and log latency:
import time
import requests
from datetime import datetime

def probe_openrouter(region_name, api_key):
    """Probe OpenRouter from a synthetic agent in region_name."""
    url = "https://api.openrouter.ai/api/v1/chat/completions"
    headers = {
        "Authorization": f"Bearer {api_key}",
        "HTTP-Referer": "https://yourapp.com",
    }
    payload = {
        "model": "openai/gpt-4-turbo",
        "messages": [{"role": "user", "content": "Hello, how are you?"}],
        "max_tokens": 100,
    }

    start = time.time()
    try:
        response = requests.post(url, json=payload, headers=headers, timeout=10)
        ttfb_ms = (time.time() - start) * 1000

        print(f"{datetime.now().isoformat()} | {region_name} | TTFB: {ttfb_ms:.0f} ms | Status: {response.status_code}")
        return ttfb_ms
    except Exception as e:
        print(f"{datetime.now().isoformat()} | {region_name} | Error: {e}")
        return None
Run this from each region daily and store results in a time-series database or log aggregator. Then query trends and set alerts on thresholds.
FAQ
Frequently Asked Questions
/status page and weekly reports make this easy. If you are using a custom probe setup, export TTFB logs to CSV and use a charting tool (Excel, Grafana, Datadog) to visualize trends. Include median, p95, and p99 in reports to stakeholders, these give a fuller picture than simple averages.Next Steps: Stay Ahead of Latency Issues
Latency monitoring is not a one-time setup. Markets change, provider infrastructure shifts, and user geography evolves. Build latency observability into your operations routine: review baselines quarterly, update thresholds as SLOs shift, and keep your team alert to regional variance.
Observinio's 21-region probes and email alerts make it easy to monitor OpenRouter without building custom infrastructure. Set up alerts for your SLO today, your on-call team (and your users) will thank you when the next regional slowdown happens and you detect it in minutes, not via support tickets.
For more, visit our status page or check our OpenRouter provider guide to configure probes for your exact latency needs.
Additional Resources
- What is OpenRouter? A Guide with Practical Examples - OpenRouter is a unified API and marketplace that gives developers access to hundreds of AI models from multiple providers through a single interface.
- OpenRouter 101: The Complete Guide to Slashing Your AI ... - OpenRouter is a unified API gateway that connects you to 500+ AI models from every major provider — Anthropic, OpenAI, Google, DeepSeek, Meta, ...
- A practical guide to OpenRouter: Unified LLM APIs, model ... - OpenRouter is a unified API gateway and marketplace for large language models, basically an abstraction layer that sits between your application ...
Monitor AI API latency from 22 regions
Observinio runs daily probes against OpenRouter and OpenAI endpoints and emails you when latency degrades.
Set up alerts