OpenAI chat completions latency baseline template
Every production system that calls the OpenAI Chat Completions API needs a latency baseline, a documented set of expected response-time numbers broken down by model, region, and payload size. Without one, you are flying blind: you cannot tell whether a 2.8-second P95 is normal for gpt-4o in Frankfurt or a sign that something is degrading. This template gives you a repeatable, copy-and-adapt framework for capturing those numbers, storing them, and turning them into actionable alerts.

Photo by Sanket Mishra from Pexels
Every production system that calls the OpenAI Chat Completions API needs a latency baseline, a documented set of expected response-time numbers broken down by model, region, and payload size. Without one, you are flying blind: you cannot tell whether a 2.8-second P95 is normal for gpt-4o in Frankfurt or a sign that something is degrading. This template gives you a repeatable, copy-and-adapt framework for capturing those numbers, storing them, and turning them into actionable alerts.
TL;DR
- A latency baseline records expected TTFB, TTFT, and end-to-end times for each model-region-payload combination you use in production.
- You need at least seven consecutive days of probe data before the baseline is statistically useful.
- The template below covers metric selection, probe design, storage format, threshold math, and alert rules.
- Baselines drift, schedule a monthly review or automate it with Observinio weekly summaries.
- Start with the three regions that serve 80 % of your traffic, then expand.
Why you need a latency baseline before anything else

Most teams discover latency problems reactively: a customer complains, an SRE spots a spike in a general-purpose dashboard, or a Slack channel fills with "is the API slow for anyone else?" messages. The root cause is almost always the same, nobody wrote down what "normal" looks like.
A baseline solves three problems at once:
- Incident detection, you can set thresholds that fire only when latency genuinely deviates, not on every random fluctuation.
- Provider comparison, when evaluating OpenAI direct versus OpenRouter, or comparing
gpt-4oagainstgpt-4o-mini, you need apples-to-apples numbers collected under identical conditions. - Capacity planning, if your P95 is already at 3.4 seconds and your SLO promises 4 seconds, you know exactly how much headroom you have before you need to add a fallback model or a second region.
Metrics to include in your baseline

Not every latency number is equally useful. The template focuses on five core metrics:
Core metric definitions
- TTFB (Time to First Byte): The interval from sending the HTTP request to receiving the first byte of the response. This captures network round-trip plus provider queue time. For streaming endpoints, TTFB is the single most important user-perceived metric because it determines how quickly the first token appears on screen.
- TTFT (Time to First Token): Closely related to TTFB but measured at the application layer after SSE parsing. In practice, TTFT = TTFB + a small deserialization overhead (usually < 20 ms). Track both if you use streaming; for non-streaming calls, TTFB alone is sufficient.
- End-to-end latency: The total wall-clock time from request sent to last byte received. For non-streaming calls this is the number your users feel. For streaming calls it matters less for perceived speed but is critical for throughput planning.
- Token throughput (tokens/second): Divide
completion_tokensby end-to-end latency. This normalizes across different output lengths and lets you compare models fairly. - Error rate: Percentage of requests returning 4xx/5xx or timing out. A baseline with a 0.3 % error rate tells you that 0.8 % is worth investigating.
"Responses: mean=4.268s median=2.349s min=1.421s max=21.711s stdev=4.903sChat : mean=1.354s median=1.298s min=0.902s max=2.385s stdev=0.330s Statistical: Store = False." >, Stateful Responses API Much Slower Than Chat Completions
That quote illustrates exactly why baselines matter: the Chat Completions endpoint shows a tight distribution (stdev 0.330 s) while the Responses API is all over the map (stdev 4.903 s). If you only tracked the mean, you would miss the massive tail latency in the Responses path.
Step-by-step: building your baseline from scratch
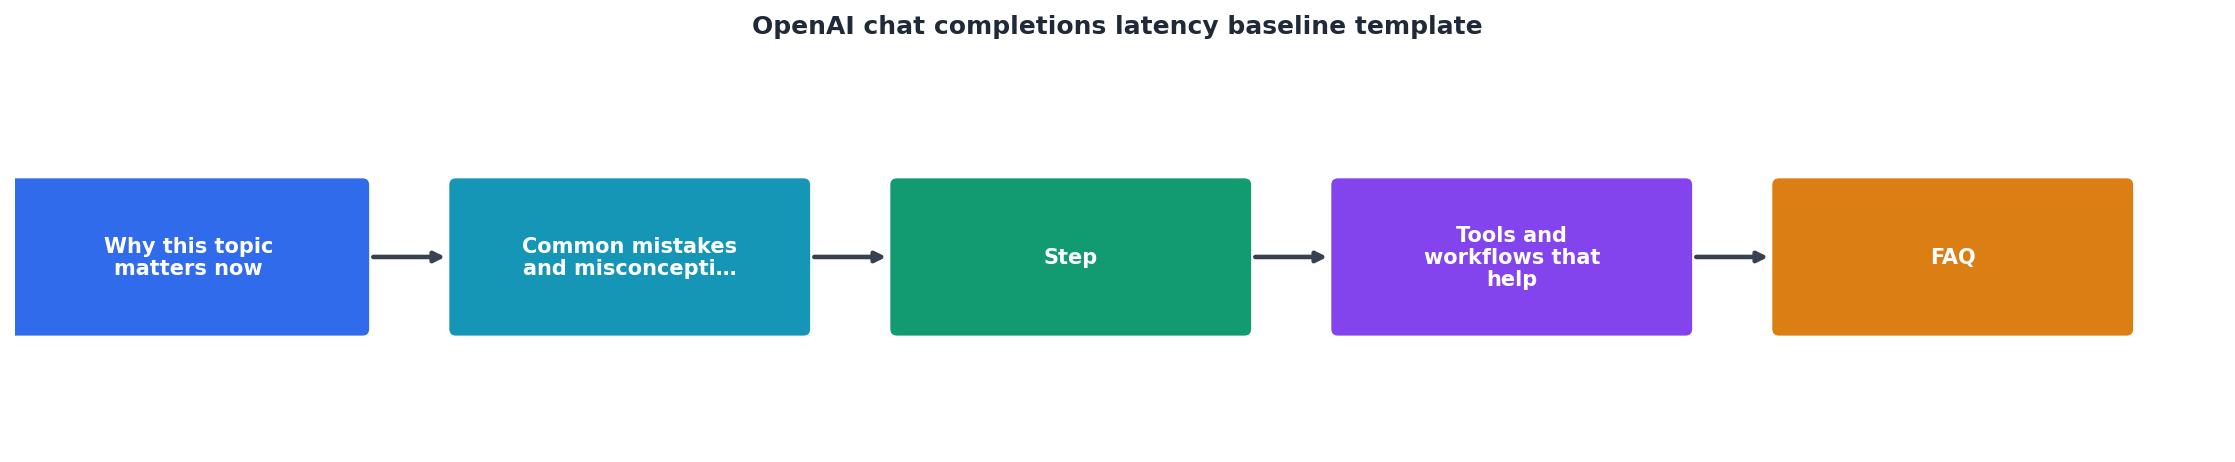
Follow these eight steps to go from zero to a production-ready baseline document.
- List your model-region-payload combinations. Create a table with every model you call in production (e.g.,
gpt-4o,gpt-4o-mini), every region your users connect from (e.g.,us-east-1,eu-west-1,ap-southeast-1), and two or three representative prompt sizes (short: ~50 tokens, medium: ~500 tokens, long: ~2 000 tokens). Each row in this table is a "probe configuration."
- Design a deterministic probe prompt. Use a fixed system message and user message so that output length is roughly consistent across runs. A good pattern is a factual question with a constrained answer length:
"Summarize the HTTP/2 protocol in exactly three sentences."Avoid creative prompts, they produce variable output lengths that add noise to your measurements.
- Choose your probe frequency. For the initial baseline period, run each probe configuration every 15 minutes. That gives you 96 data points per day per configuration. After the baseline is established, you can drop to every 30 or 60 minutes for ongoing monitoring.
- Run probes for at least seven days. Weekday and weekend traffic patterns differ on the provider side. Seven days captures both. If you can afford 14 days, even better, you will catch biweekly maintenance windows and model update rollouts.
- Store raw results in a structured format. Each probe result should include: timestamp (UTC), region, model, prompt token count, completion token count, TTFB (ms), TTFT (ms), end-to-end latency (ms), HTTP status code, and any error message. A simple JSON Lines file or a Postgres table works fine.
- Compute summary statistics. After the collection window closes, calculate mean, median, P90, P95, P99, min, max, and standard deviation for each metric, grouped by model-region-payload. These numbers are your baseline.
- Set alert thresholds. A common starting point: alert when the rolling 15-minute P95 exceeds the baseline P95 by more than 40 %, or when the error rate exceeds twice the baseline error rate. Tune these multipliers after a few weeks of real alerts.
- Document and version the baseline. Store the baseline table in your repository alongside your infrastructure code. Include the collection date range, probe prompt text, and any provider-side notes (e.g., "collected during OpenAI API version 2025-06-01"). When you re-baseline, keep the old version for comparison.
Baseline template (copy and adapt)
Below is a ready-to-use Markdown table you can paste into your team wiki or repo. Fill in the numbers from your probe data.
Model Region Payload TTFB P50 TTFB P95 E2E P50 E2E P95 Tok/s P50 Error % Collection Period gpt-4o us-east-1 short ms ms ms ms % YYYY-MM-DD – MM-DD gpt-4o us-east-1 medium ms ms ms ms % gpt-4o eu-west-1 short ms ms ms ms % gpt-4o-mini us-east-1 short ms ms ms ms % gpt-4o-mini ap-southeast-1 medium ms ms ms ms %
Probe configuration checklist
Use this checklist every time you set up or modify a probe:
Your progress is saved automatically in your browser.
Keeping the baseline current

A baseline is not a one-time artifact. OpenAI ships model updates, adjusts rate limits, and changes infrastructure routing regularly. A baseline from three months ago may be dangerously stale.
When to re-baseline
- After a model version change. When OpenAI updates
gpt-4oto a new snapshot, run a fresh seven-day collection. Compare the new numbers to the old baseline and update your alert thresholds. - After you change regions. If you add
ap-northeast-1to your deployment, you need baseline data for that region before you can set meaningful alerts. - Monthly, as a hygiene practice. Even without obvious changes, provider-side infrastructure evolves. A monthly re-baseline catches gradual drift. Observinio's weekly summary emails make this easy, they show you the trailing seven-day P50 and P95 for every model-region pair, so you can compare against your stored baseline without running a manual collection.
- After an incident. If you experienced a prolonged degradation event, exclude that window from your baseline data or re-collect. Contaminated baselines lead to overly generous thresholds.
Automating baseline comparison
Instead of manually comparing spreadsheets, write a simple script that pulls the latest week of probe data, computes summary statistics, and diffs them against the stored baseline. Flag any metric where the new value exceeds the baseline by more than your chosen tolerance (e.g., 20 % for P50, 40 % for P95). This script can run as a weekly cron job or be triggered by Observinio's webhook integration.
A minimal Python snippet for the comparison logic:
def check_drift(current: dict, baseline: dict, tolerance: float = 0.4) -> list:
    """Return list of metrics that drifted beyond tolerance."""
    alerts = []
    for metric in ["ttfb_p95", "e2e_p95", "error_rate"]:
        if baseline[metric] == 0:
            continue
        drift = (current[metric] - baseline[metric]) / baseline[metric]
        if drift > tolerance:
            alerts.append({
                "metric": metric,
                "baseline": baseline[metric],
                "current": current[metric],
                "drift_pct": round(drift  100, 1),
            })
    return alerts
Alert threshold calculator
Enter your baseline P95 latency and desired tolerance to compute the alert threshold.
Click Calculate to see your threshold.
Common mistakes to avoid
Teams that build baselines for the first time often fall into these traps:
- Using a single global average. A 1.8-second global mean hides the fact that
ap-southeast-1runs at 3.2 seconds. Always segment by region. - Collecting for only one day. One day of data captures one traffic pattern. You need at least seven days to see weekday/weekend variance and provider maintenance windows.
- Ignoring prompt size. A 50-token prompt and a 2 000-token prompt produce very different latency profiles on the same model. Baseline both.
- Setting thresholds too tight. If your alert fires on every 10 % deviation, you will get paged constantly and start ignoring alerts. Start at 40 % above P95 and tighten gradually.
- Never re-baselining. A six-month-old baseline is worse than no baseline because it gives false confidence. Schedule re-collection or use automated drift detection.
FAQ
Frequently Asked Questions
Start monitoring before your next incident
Building a latency baseline is the first step; keeping it current is the ongoing work. If you would rather skip the probe infrastructure and get straight to the data, Observinio already tracks OpenAI Chat Completions latency from 21 regions with daily probes, degradation alerts, and weekly summary emails. Set up alerts once and let the baseline come to you, so the next time latency drifts, you find out from an email, not from a customer.
Additional Resources
- Stateful Responses API Much Slower Than Chat ... - On Chat Completions, GPT-5 (minimal reasoning) is averaging about 5-7 sec for me, 50+ message history and almost 100k tokens. averaging 11 ...
- Performance analysis of Assistants versus Chat completion ... - This comparative analysis measured latency times for chat completions versus assistants API for GPT-4 models (4-1106 and 4-0125) within the ...
- Client.chat.completions.create latency - API - When I call client.chat.completions.create it gives very high latency of more than 9 seconds. latency is less than 3 seconds.. OpenAI Chat ...
Monitor AI API latency from 22 regions
Observinio runs daily probes against OpenRouter and OpenAI endpoints and emails you when latency degrades.
Set up alerts