OpenAI / Anthropic status page monitoring checklist
When your production features depend on OpenAI's GPT models or Anthropic's Claude, the provider's official status page is the first place you check during an incident, and often the last place to actually confirm a problem. Both status.openai.com and status.anthropic.com are powered by Atlassian Statuspage, which means they share the same update cadence, component taxonomy, and notification options. This checklist gives you a repeatable process for subscribing to the right signals, filtering out noise, and layering independent monitoring on top so you catch degradations before the status page turns yellow.

Photo by Shantanu Kumar from Pexels
When your production features depend on OpenAI's GPT models or Anthropic's Claude, the provider's official status page is the first place you check during an incident, and often the last place to actually confirm a problem. Both status.openai.com and status.anthropic.com are powered by Atlassian Statuspage, which means they share the same update cadence, component taxonomy, and notification options. This checklist gives you a repeatable process for subscribing to the right signals, filtering out noise, and layering independent monitoring on top so you catch degradations before the status page turns yellow.
TL;DR
- Both OpenAI and Anthropic run Atlassian Statuspage instances, subscribe to component-level updates, not just top-level incidents, to catch API-specific degradations early.
- Email and webhook subscriptions are free but delayed; pair them with synthetic latency probes that measure TTFB and TTFT from your users' actual regions.
- Create a runbook entry that maps each status page component to your internal services so on-call knows exactly what is affected.
- Use RSS or Atom feeds piped into your incident channel (Slack, PagerDuty, etc.) for near-real-time awareness.
- Layer Observinio's 21-region daily probes on top to detect regional slowdowns the provider's status page will never surface.
Why official status pages are necessary but not sufficient
Official status pages serve a specific purpose: they communicate provider-acknowledged incidents. That is valuable for postmortems and stakeholder communication, but it comes with structural limitations you need to understand before relying on them as your primary signal.
What status pages do well
- Canonical incident timeline. Once an incident is posted, you get timestamped updates that are useful for root-cause analysis and SLA credit claims.
- Component granularity. OpenAI breaks its page into components like "API," "ChatGPT," and "Playground." Anthropic similarly separates "API" from "Console." You can subscribe to only the components your stack touches.
- Multiple notification channels. Both pages offer email, SMS, webhook, RSS, and Atom subscriptions at no cost.
Where they fall short
- Detection lag. Status pages are updated by humans (or human-approved automation). It is common for a degradation to be visible in your own metrics 10–30 minutes before the status page reflects it.
- No regional breakdown. A status page will say "API, Degraded Performance" but will not tell you whether the problem is isolated to requests originating from Europe, Asia-Pacific, or everywhere.
- Binary states. Components are either Operational, Degraded, Partial Outage, or Major Outage. A 40% increase in p95 TTFB that stays below the provider's internal threshold may never appear on the page at all.
- No latency baselines. You cannot see historical TTFB or TTFT trends. The page tells you the current state, not whether performance has been slowly regressing over the past week.
Step-by-step: subscribing to OpenAI and Anthropic status pages

Follow these steps for each provider. The process is nearly identical because both use Atlassian Statuspage.
OpenAI (status.openai.com)
- Open the page and click Subscribe to Updates in the top-right corner.
- Choose your channel. Select Email, SMS, Slack (via webhook), or RSS/Atom. For ops teams, webhook is the most flexible option because you can route it into PagerDuty, Opsgenie, or a custom Lambda.
- Select components. Uncheck "ChatGPT" and "Playground" if you only consume the API programmatically. This reduces noise significantly, ChatGPT web outages do not always correlate with API issues.
- Confirm the subscription. For email, check your inbox and click the verification link. For webhooks, verify the test payload arrives in your endpoint.
- Add the RSS feed (
https://status.openai.com/history.rss) to your incident Slack channel using the/feed subscribecommand or an RSS-to-Slack integration.
Anthropic (status.anthropic.com)
- Open the page and click Subscribe to Updates.
- Choose your channel, same options as above. Webhook is again recommended for ops workflows.
- Select components. If you only use the Messages API, you can skip Console-related components.
- Confirm the subscription via the verification step for your chosen channel.
- Add the RSS feed (
https://status.anthropic.com/history.rss) to the same incident channel so both providers' updates land in one place.
Pro tip: webhook deduplication
Both pages can fire multiple webhook calls for a single incident (created, updated, resolved). Make sure your receiving endpoint is idempotent, deduplicate on the incident.id field in the JSON payload to avoid alert fatigue.
The complete monitoring checklist
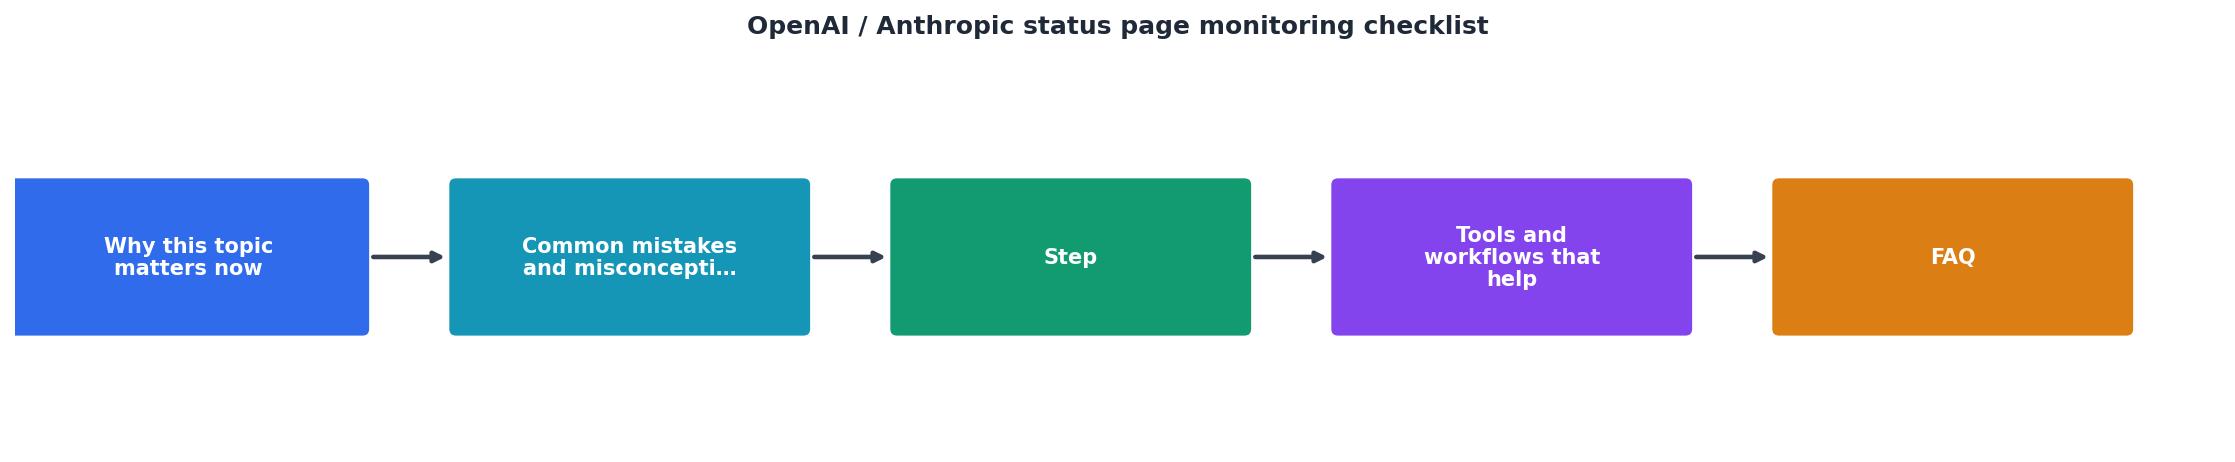
Use this checklist as a one-time setup task and revisit it quarterly. Print it, paste it into your runbook, or convert it into Jira tickets, whatever fits your workflow.
Your progress is saved automatically in your browser.
Layering independent monitoring for regional visibility

The biggest blind spot of any official status page is regional granularity. When OpenAI reports "API, Degraded Performance," you have no way of knowing whether requests from Frankfurt are affected the same way as requests from Tokyo. For teams serving a global user base, this distinction matters enormously, a 300 ms TTFB increase in a region where your heaviest traffic originates can tank user experience while the aggregate global metric barely moves.
What to measure
- TTFB (Time to First Byte): How long until the first byte of the HTTP response arrives. This captures network latency plus the provider's queue and inference startup time.
- TTFT (Time to First Token): For streaming completions, this is the time until the first token is emitted. It is the metric your users actually feel, the delay before text starts appearing.
- Regional variance: The difference in TTFB or TTFT between your fastest and slowest regions. A healthy provider shows relatively consistent latency; a spike in one region often indicates a localized infrastructure issue.
How Observinio fills the gap
Observinio runs daily probes from 21 global regions against OpenAI (direct) and OpenRouter endpoints. Each probe records TTFB and compares it against a rolling baseline for that specific region and model. When a region's latency deviates beyond the threshold, Observinio sends a degradation alert via email, often well before the provider's status page is updated.
You can check the current state at any time on the Observinio status page or drill into provider-specific data on the OpenRouter provider page. This gives you the regional breakdown that status.openai.com and status.anthropic.com simply do not provide.
Combining signals for faster incident response
| Cecha | Oficjalny status page | Niezależny monitoring (Observinio) |
|---|---|---|
| Czas wykrycia | 10–30 min opóźnienia | Wykrycie w ciągu minut |
| Granularność regionalna | Brak | 21 regionów |
| Metryki latencji | Brak (tylko status) | TTFB i TTFT z baselinami |
| Dane historyczne | Tylko log incydentów | Trendy dzienne i tygodniowe |
| Koszt | Bezpłatny | Bezpłatne alerty e-mail |
The most effective setup uses both sources in parallel:
- Observinio alert fires, latency in
eu-west-1forgpt-4ohas exceeded the baseline by 60%. - On-call checks the official status page, still showing "Operational."
- On-call opens the Observinio status page, confirms the degradation is isolated to two European regions.
- Team decides to route traffic to a secondary model or provider for affected regions while waiting for the provider to acknowledge the issue.
- Status page updates 15 minutes later, "API, Degraded Performance." Your users never noticed because you already mitigated.
Frequently Asked Questions
Key takeaway: Oficjalne strony statusowe OpenAI i Anthropic dostarczają kanoniczny zapis incydentów, ale nie zastąpią niezależnego monitoringu wieloregionowego. Subskrybuj oba status page'e na poziomie komponentów, zmapuj je do swoich wewnętrznych usług, a następnie nałóż automatyczne sondy latencji z wielu regionów, aby wykrywać degradacje zanim dostawca je potwierdzi i reagować proaktywnie zamiast reaktywnie.
Start monitoring before the next incident
Official status pages from OpenAI and Anthropic are a necessary part of your monitoring stack, but they should never be the only part. Subscribe to both pages using the checklist above, map their components to your internal services, and then layer independent, multi-region latency monitoring on top. Observinio's daily probes across 21 regions, baseline comparisons, and email degradation alerts give you the early warning and regional detail that no official status page provides. Set up your alerts today and turn the next provider incident into a non-event for your users.
Monitor AI API latency from 22 regions
Observinio runs daily probes against OpenRouter and OpenAI endpoints and emails you when latency degrades.
Set up alerts