On-call escalation matrix for LLM outages
When an LLM API slows to a crawl at 2 a.m., your on-call engineer faces a critical choice: troubleshoot locally, escalate to the platform team, or wake the VP? Without a clear escalation matrix, decisions cascade into chaos, wasted time, notification fatigue, and delayed resolution. This resource walks you through building a practical escalation matrix tailored to LLM outages, where latency anomalies and regional degradation demand precise triage.

Photo by RDNE Stock project from Pexels
When an LLM API slows to a crawl at 2 a.m., your on-call engineer faces a critical choice: troubleshoot locally, escalate to the platform team, or wake the VP? Without a clear escalation matrix, decisions cascade into chaos, wasted time, notification fatigue, and delayed resolution. This resource walks you through building a practical escalation matrix tailored to LLM outages, where latency anomalies and regional degradation demand precise triage.
TL;DR
- Define escalation by impact (latency SLO breach, error rate spike, regional isolation, multi-region outage) and response time SLAs, not just raw urgency.
- Assign clear ownership at each level: L1 (monitoring alert + local checks), L2 (platform investigation), L3 (exec communication + provider liaison).
- Use latency baselines and regional variance data to distinguish signal from noise, a 200 ms spike in Tokyo may be normal; a 500 ms spike in US East is not.
- Automate low-context decisions (page L2 if TTFB > 2s globally for 5+ minutes) and require human judgment for nuanced failures (partial regional outage, cost-explosion scenarios).
- Test your matrix quarterly with fire drills; update it after each major incident.
Why escalation matrices fail for LLM APIs

Most on-call playbooks were built for traditional infrastructure: database down, server CPU at 99%, API returning 500s. But LLM APIs introduce unique failure modes that generic escalation matrices miss:
Regional latency variance is normal. OpenAI and OpenRouter endpoints respond differently in different regions. A 300 ms TTFB in Singapore, when baseline is 250 ms, should not trigger the same alarm as the same delta in your primary region. Generic matrices treat latency as global and binary (fast / slow) rather than regional and statistical.
Partial outages are common. A provider's EU endpoint may degrade while US remains healthy, or token throughput (TTFT) stays fast while first-token latency (TTFB) climbs. Single-threshold alerting misses these patterns.
The provider is often the bottleneck, not your stack. Your local troubleshooting cannot fix an OpenRouter regional degradation. But without regional probe data, your L1 engineer spends 15 minutes checking their own systems before escalating.
Cost and latency trade off. Rerouting traffic to avoid a slow region may spike API costs by 40%. Your escalation matrix must surface this tradeoff early so a platform engineer decides, not your on-call engineer guessing.
Generic escalation matrices collapse under this complexity. The solution is to build one that:
- Uses real latency baselines to distinguish anomalies from noise.
- Breaks incidents into tiers by scope (single region, multi-region, provider-wide) and impact (user-facing latency, error rate, cost).
- Automates low-stakes decisions so humans focus on judgment calls.
- Defines crisp escalation triggers with time windows and SLO thresholds.
Designing your matrix: tiers and triggers

Start by defining your tiers. A typical LLM-aware escalation matrix has four levels:
Level 1: Monitor & Local Check (On-call engineer)
Scope: Single region, small latency anomaly, or provider status page reports normal.
Response time: 5 minutes.
Actions:- Confirm alert source (Observinio probe vs. real user traffic).
- Check provider status page (openai.com/status, etc.) and X/Twitter for complaints.
- Review your own regional dashboards: did traffic shift, did error rate spike, did your service just deploy?
- If inconclusive after 2 minutes, escalate to L2.
Level 2: Platform Investigation (Platform or SRE team)
Scope: Multi-region latency spike, provider switching needed, or suspected provider-side outage.
Response time: 15 minutes to first response, 30 minutes to initial mitigation.
Actions:- Pull latency and error-rate graphs from Observinio across all 21 regions. Is it global or regional?
- Compare TTFB (first-token time) vs. TTFT (throughput). If only TTFB is elevated, it may be provider startup overhead; if TTFT too, suspect throttling.
- Contact the provider's support via existing channels if your SLA includes it.
- Run a request from a controlled environment (your VPN, staging box) to isolate your traffic from user-generated noise.
- Decide: wait for provider recovery, reroute traffic, or trigger fallback model?
- Update #incidents channel with findings every 10 minutes.
Level 3: Executive & Provider Liaison (Ops lead or VP Eng)
Scope: Multi-provider outage, SLA violation, major cost implications, or external communication needed.
Response time: Immediate. Page on-call director.
Actions:- Authorize rerouting decisions with cost implications (e.g., "switch 50% of traffic to Anthropic Claude for 1 hour, +$200 expected cost").
- Reach out to provider's account manager or escalation contact for faster response.
- Prepare customer comms: status page update, email, or support ticket responses.
- Log incident postmortem task.
Level 4: Crisis (C-suite if customer revenue at risk)
Scope: Service unavailable, SLA breach not recoverable, customer escalation inbound.
Response time: CEO or COO in loop.
Actions: Notify affected customers directly, waive or credit usage, evaluate provider contract changes.
Escalation trigger: > 60 minute outage affecting paying customers, or enterprise customer threatening churn.
Building the decision tree
The true power of an escalation matrix is its decision tree, the if-then logic that determines which level to page. Rather than vague guidelines, use concrete metrics tied to your SLOs.
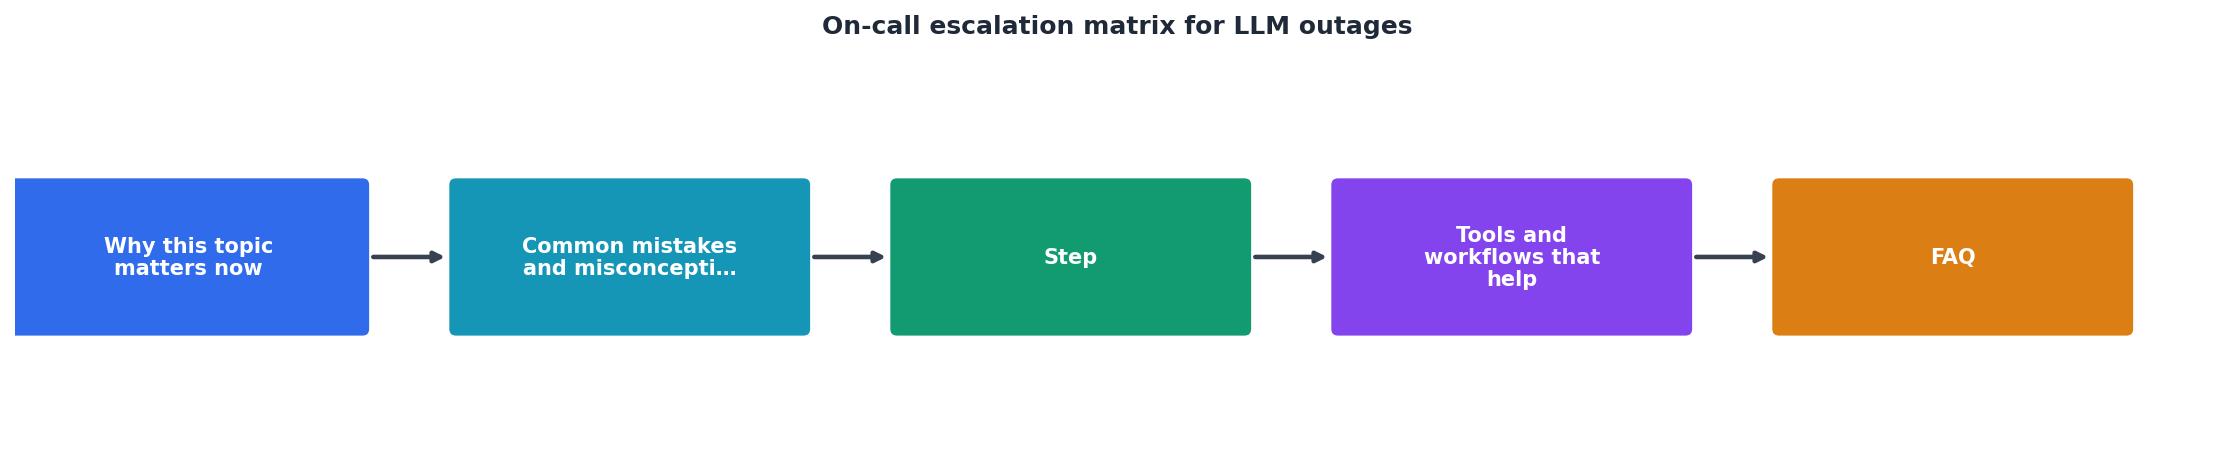
Here is a practical example:
If TTFB > 2000 ms (2 seconds) globally for 5+ consecutive minutes:- Page L2 (platform team).
- This is 4x your baseline of 500 ms and definitely anomalous.
- Page L2 to investigate provider health in that region.
- L2 decides whether to wait or reroute. If rerouting cost is < $50, L2 can authorize. Otherwise, escalate to L3.
- Page L2 immediately.
- This suggests provider instability or overload, not just latency.
- L1 handles. Log it but no escalation unless pattern repeats.
- Page L2 and L3 together; indicates provider-wide issue or your routing layer broken.
- Escalate to L3. Executive may need to authorize fallback or customer comms while L2 continues digging.
Practical implementation: the playbook checklist

To make your matrix real, encode it into an on-call runbook your team will actually use. Here is a checklist template:
LLM API Outage Runbook
Your progress is saved automatically in your browser.
"Support managers see 30-40% reductions in escalation rates from spending just 20 minutes twice a day tracking customer behavior in SupportLogic twice a day.">, Escalation Matrix Best Practices: Beyond the Basics
The lesson carries over: time spent upfront on structured incident response saves far more time during crisis. When every engineer knows the triage flow, incidents are contained faster and executive time is preserved for decisions, not firefighting.
Testing and iteration
Your matrix is not static. After each outage, even small ones, hold a 20-minute postmortem. Ask:
- Did the escalation trigger fire when it should have?
- Was the right level paged?
- Could L1 have resolved it without L2?
- Could L2 have decided faster with more context?
Run a fire drill quarterly. Simulate a major outage scenario and walk through your matrix. This catches gaps and keeps everyone sharp. Use Observinio's regional data during drills to make them realistic.
FAQ
Frequently Asked Questions
Next steps: monitor and stay ready
Escalation matrices work only if they are wired into your alerting. Observinio's degradation alerts and regional breakdowns give you the signal you need to trigger the right tier at the right time. Set up alerts tied to your SLOs (TTFB > your threshold, error rate > your threshold, multi-region flag) and map each to a Slack channel or PagerDuty policy that pages the correct level.
Implementation Checklist
Week 1: Define your SLO thresholds and regional baselines. Document triggers for each escalation level.
Week 2: Wire alerts into your monitoring platform (PagerDuty, OpsGenie, etc.). Test routing to team channels.
Week 3: Run a fire drill with your team. Simulate a multi-region outage and walk through the playbook end-to-end.
Week 4: Review and refine based on feedback. Update thresholds if needed and schedule quarterly reviews.
Once your matrix is live, run a fire drill. Simulate a regional outage and walk through the playbook. Fix gaps, clarify ownership, and iterate. Within a month, you will find that on-call rotations run smoother, incidents resolve faster, and your team is less burned out.
For a deeper look at regional latency trends and to set up baseline comparisons across your LLM providers, check out our status page or OpenRouter provider insights. Questions about setting up alerts or scaling your monitoring? Get in touch.
Additional Resources
- The Escalation Matrix: Best Practices and Going Beyond - A support escalation matrix is a great way for companies to create an optimal customer service escalation process and avoid slow, stressful ...
- Escalation policies for effective incident management - An escalation matrix is a document or system that defines when escalation should happen and who should handle incidents at each escalation level.
- Escalation policy best practices: designing ... - TL;DR: Effective escalation policies route alerts directly to service owners, automate role assignments, and keep response workflows inside ...
Monitor AI API latency from 22 regions
Observinio runs daily probes against OpenRouter and OpenAI endpoints and emails you when latency degrades.
Set up alerts