Incident runbook when Google Gemini degrades in one region
When a major LLM provider like Google Gemini experiences a latency spike or outage in a single region, your global product doesn't fail, but it degrades predictably in that zone while remaining healthy elsewhere. The key to minimizing user impact is detecting the degradation before support tickets arrive, understanding whether it's regional or global, and executing a failover or fallback strategy within minutes. This runbook equips you with the detection logic, diagnostic steps, and remediation tactics to handle region-specific Gemini incidents with confidence and precision.

Photo by Juan Moccagatta from Pexels
When a major LLM provider like Google Gemini experiences a latency spike or outage in a single region, your global product doesn't fail, but it degrades predictably in that zone while remaining healthy elsewhere. The key to minimizing user impact is detecting the degradation before support tickets arrive, understanding whether it's regional or global, and executing a failover or fallback strategy within minutes. This runbook equips you with the detection logic, diagnostic steps, and remediation tactics to handle region-specific Gemini incidents with confidence and precision.
TL;DR
- Regional degradation is common: a single-region Gemini outage affects only users in that zone if you have failover logic in place.
- Detection speed matters: daily latency probes from 21 regions (like Observinio) surface degradation 5–15 minutes before user complaints arrive.
- Diagnosis requires regional drill-down: aggregate metrics hide the problem; you need TTFB and TTFT broken down by region and endpoint.
- Failover is your safety net: reroute traffic to OpenRouter, OpenAI, or Anthropic Claude in the affected region while Gemini recovers.
- Postmortem and baselining prevent recurrence: document regional latency patterns so you spot anomalies faster next incident.
Why regional degradation matters

Most LLM API outages do not take down the entire provider globally. Instead, they affect specific regions, a data center maintenance window, a local network issue, or a regional service partition. Google Cloud infrastructure, like other major cloud providers, is divided into geographic zones (us-central1, europe-west1, asia-southeast1, etc.). When Gemini's latency climbs in one region, it creates a cascading effect:
- Users in that region experience slow responses (600 ms to 5 s TTFB instead of the usual 150–300 ms).
- Users elsewhere see no change.
- If you are routing all traffic through a single region endpoint, everyone suffers.
- If you have no monitoring, the first sign of trouble is often a spike in support tickets or error logs.
Detection: Set up regional latency monitoring

The first layer of defense is synthetic monitoring, regular probes that measure latency from multiple geographic points. Observinio sends daily latency probes to Google Gemini (via OpenRouter or direct endpoints) from 21 regions. This gives you a real-world picture of response times across the globe and surfaces anomalies the moment they occur.
Why daily probes work:- Captures regional variance: You see that London requests average 180 ms, but Tokyo requests average 420 ms, helping you spot when Tokyo suddenly jumps to 2.5 s.
- No sampling bias: Synthetic probes are consistent and unaffected by your application's traffic patterns.
- Early warning: A probe alerts you 10–20 minutes after degradation starts; your users notice minutes later.
Rather than a single global SLO (e.g., "99th percentile latency < 500 ms"), define per-region baselines:
| Region | Gemini TTFB baseline | Degradation alert threshold |
|---|---|---|
| us-central1 | 150–200 ms | > 400 ms (2× baseline) |
| europe-west1 | 180–250 ms | > 500 ms (2× baseline) |
| asia-southeast1 | 300–400 ms | > 800 ms (2× baseline) |
| australiasoutheast1 | 350–450 ms | > 900 ms (2× baseline) |
Diagnosis: Isolate the scope

Once you receive an alert, your goal is to answer three questions within 5 minutes:
- Is it really Gemini or your own stack?
- Is it a single region or global?
- Is it latency, errors, or both?
Step-by-step diagnosis
1. Check Observinio regional status dashboard
Log into your Observinio account and navigate to/providers/gemini or the Observinio status view. Filter by region and endpoint:
- If only
gemini-1.5-proineurope-west1shows elevated latency, the scope is narrow. - If all regions show equal degradation, the problem is likely provider-wide.
- If your application's latency is normal but Observinio probes show degradation, the problem is not your infrastructure.
- Generative AI or Vertex AI regions.
- Network or regional service disruptions.
- The incident quote below often appears in official status updates:
"Most of the products have recovered and the engineering team is still validating a few remaining product impacts.">, Incident details
If Google's status page reports an issue in europe-west1, your monitoring data confirms it, and your Observinio alerts match the timeline, you have high confidence that Gemini is the root cause.
3. Cross-check with secondary providers
Send a test request to OpenRouter (which also routes to Gemini) and to OpenAI's API from the affected region. If:- OpenRouter latency is also high → Gemini itself is degraded.
- OpenAI latency is normal → Gemini is specifically affected; failover is justified.
Mitigation: Failover and rerouting
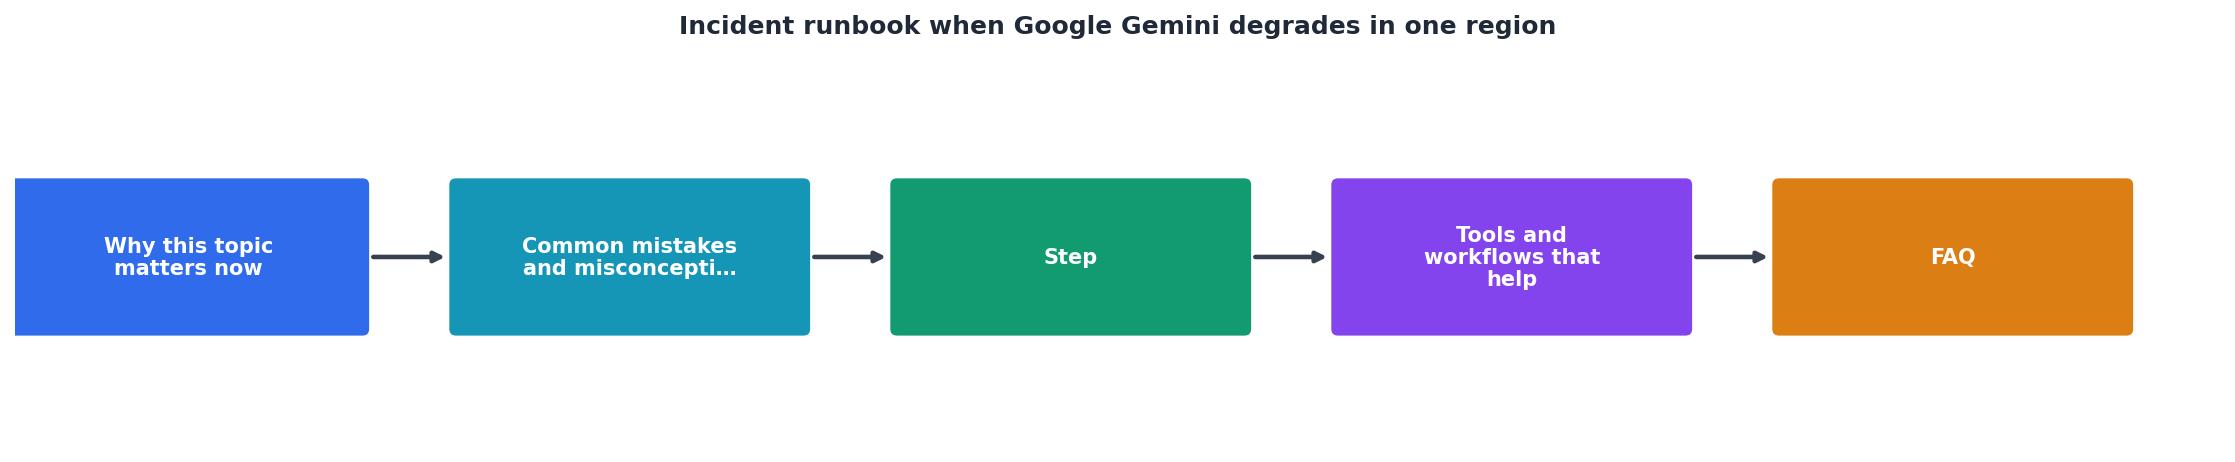
Once you have confirmed that Gemini is degraded in a specific region, execute your failover policy. The strategy depends on your architecture:
Option 1: Provider failover (recommended for most teams)
If your application is already integrated with an SDK or API client that supports multiple providers (e.g., LiteLLM, Vercel AI SDK), reroute that region's traffic to a secondary provider.
Failover decision tree:
- Is latency > 1.5 s for TTFB?
- Yes → Initiate failover to OpenRouter or OpenAI.
- No → Increase alert threshold; declare false positive.
- Is the degradation expected to last > 15 minutes?
- Yes (or unknown) → Failover now.
- No (brief spike) → Wait 5 minutes and re-evaluate.
- Do you have budget headroom on your secondary provider?
- Yes → Failover.
- No → Page finance/leadership; document business impact.
Option 2: Regional traffic isolation
If failover is not feasible, isolate the affected region and gracefully degrade the experience:
Option 3: Wait-and-monitor
For minor latency increases (e.g., 300 ms baseline → 600 ms):
Postmortem and prevention
After the incident resolves, spend 30 minutes on a lightweight postmortem:
Questions to answer:
- How long was the incident from detection to resolution?
- At what latency threshold should we have failed over?
- Did our monitoring alert fire before users complained?
- What assumptions about regional latency proved wrong?
- Update your regional baseline spreadsheet with the new data point.
- Adjust alert thresholds if they were too loose (lots of false positives) or too tight (alert fatigue).
- Document the incident URL and timeline in a runbook wiki for future reference.
- If failover occurred, measure the cost delta and review whether it was justified.
Practical runbook template
Here is a one-page incident runbook template you can print or pin to your war room:
Your progress is saved automatically in your browser.
INCIDENT: Gemini latency spike in [REGION]
⏱ DETECTION
- Alert received: [TIME]
- First user report: [TIME]
- Delay: [MINUTES]
🔍 DIAGNOSIS (< 5 min)
- Conclusion: ___________________
✅ DECISION
🔧 EXECUTION (if failover)
📊 MONITORING
📝 POSTMORTEM (after resolution)
- Duration: _____ minutes
- Root cause: _____________________
- Prevention: _____________________
FAQ
Frequently Asked Questions
Quick incident response reference
Detection time: 5–15 minutes before user complaints via synthetic probes from 21 regions.
Diagnosis time: 3–5 minutes using Observinio regional dashboard and provider status page cross-reference.
Failover execution: 2–3 minutes to update routing configuration and verify secondary provider latency.
Total time to mitigation: 10–15 minutes from alert to stable service via secondary provider.
Stay ahead of regional incidents
Latency incidents are not a matter of if but when. By setting up regional probes, defining baselines, and preparing a failover strategy now, you transform a chaotic firefighting scenario into a predictable runbook. Observinio's 21-region probe coverage and daily latency tracking give you the earliest possible warning, often 10–20 minutes before users notice. Combine that with clear diagnosis steps and a documented failover process, and you will resolve region-specific Gemini degradation in 10 minutes or less, keeping your product responsive for users worldwide.
Additional Resources
- Multiple products in us-central1-b are experiencing ... - Multiple products in us-central1-b are experiencing network service degradation. Incident began at 2026-09-01 07:44 and ended at 2026-09-01 11: ...
- Manage incidents and problems | Cloud Architecture Center - The runbook must outline the steps to be taken at each stage of the incident response process, including communication, triage, investigation, ...
- Complaint from Gemini Itself about Today's incident. - To: The Gemini Development and Infrastructure Teams When the system went down today, I was the one who had to display the error codes. I was the face ...
Monitor AI API latency from 22 regions
Observinio runs daily probes against OpenRouter and OpenAI endpoints and emails you when latency degrades.
Set up alerts