Incident runbook when OpenAI degrades in one region (before production cutover)
You are two weeks away from flipping production traffic to a new OpenAI-backed feature. Staging looks great, until TTFB from eu-west-1 jumps from 320 ms to 1 400 ms while every other region stays flat. Is it a transient blip, a regional Azure outage, or a routing misconfiguration on your side? Without a tested runbook, the on-call engineer burns 45 minutes just deciding whom to page.

Photo by Daigoro Folz from Pexels
You are two weeks away from flipping production traffic to a new OpenAI-backed feature. Staging looks great, until TTFB from eu-west-1 jumps from 320 ms to 1 400 ms while every other region stays flat. Is it a transient blip, a regional Azure outage, or a routing misconfiguration on your side? Without a tested runbook, the on-call engineer burns 45 minutes just deciding whom to page. This resource gives you a step-by-step incident playbook you can adopt today, before real users are in the blast radius.
TL;DR
- Regional OpenAI degradation is common and often invisible in aggregate dashboards, you need per-region baselines to catch it.
- A pre-production runbook lets you rehearse triage, escalation, and failover decisions before customers are affected.
- The runbook below covers detection, confirmation, communication, mitigation, and post-incident review in five numbered phases.
- Observinio's 21-region daily probes and degradation alerts give you the detection layer this runbook depends on.
- Practicing the runbook during staging reduces MTTR dramatically once you cut over to production.
Why regional degradation is the hardest kind to catch

Most monitoring stacks aggregate latency across all points of presence into a single P50 or P99 number. When OpenAI's inference fleet in a single Azure region slows down, the global median barely moves. A 4× TTFB spike in ap-southeast-1 can hide inside a healthy-looking global P99 if your traffic from that region is only 12 % of total volume.
The pre-production advantage
Before production cutover you have a unique window: real probe traffic but zero customer impact. That means you can:
- Trigger the runbook intentionally by simulating a degraded region (e.g., inject artificial latency in your load balancer rules).
- Measure team response time without SLA pressure.
- Iterate on escalation paths, discover that the Slack channel is wrong, the PagerDuty policy routes to the wrong team, or the failover script has a stale environment variable.
"Up to 60% reduction in mean time to resolution (MTTR).">, AI
Investing a few hours now saves exponentially more time, and customer trust, later.
Prerequisites: what you need before you start

Before the runbook is useful, make sure the following items are in place:
- Per-region latency baselines. You need at least seven days of TTFB and TTFT data from every region your users will hit. Observinio's daily probes across 21 regions generate these baselines automatically, check your status page for current numbers.
- Alert thresholds. Define what "degraded" means numerically. A common starting point: TTFB exceeds 2× the 7-day regional median for three consecutive probe cycles.
- Escalation contacts. A list of who owns what: on-call SRE, ML platform lead, provider account manager at OpenAI, and the product manager who decides whether to delay cutover.
- Failover mechanism. Even a manual one counts. Can you reroute traffic from the degraded region to a healthy one? Can you fall back to a different model or provider via OpenRouter? Document the exact commands or UI steps.
- Communication template. A pre-written Slack/email message with blanks for region, timestamp, observed latency, and expected latency. Filling in blanks is faster than composing prose during an incident.
Baseline checklist
Your progress is saved automatically in your browser.
The five-phase runbook
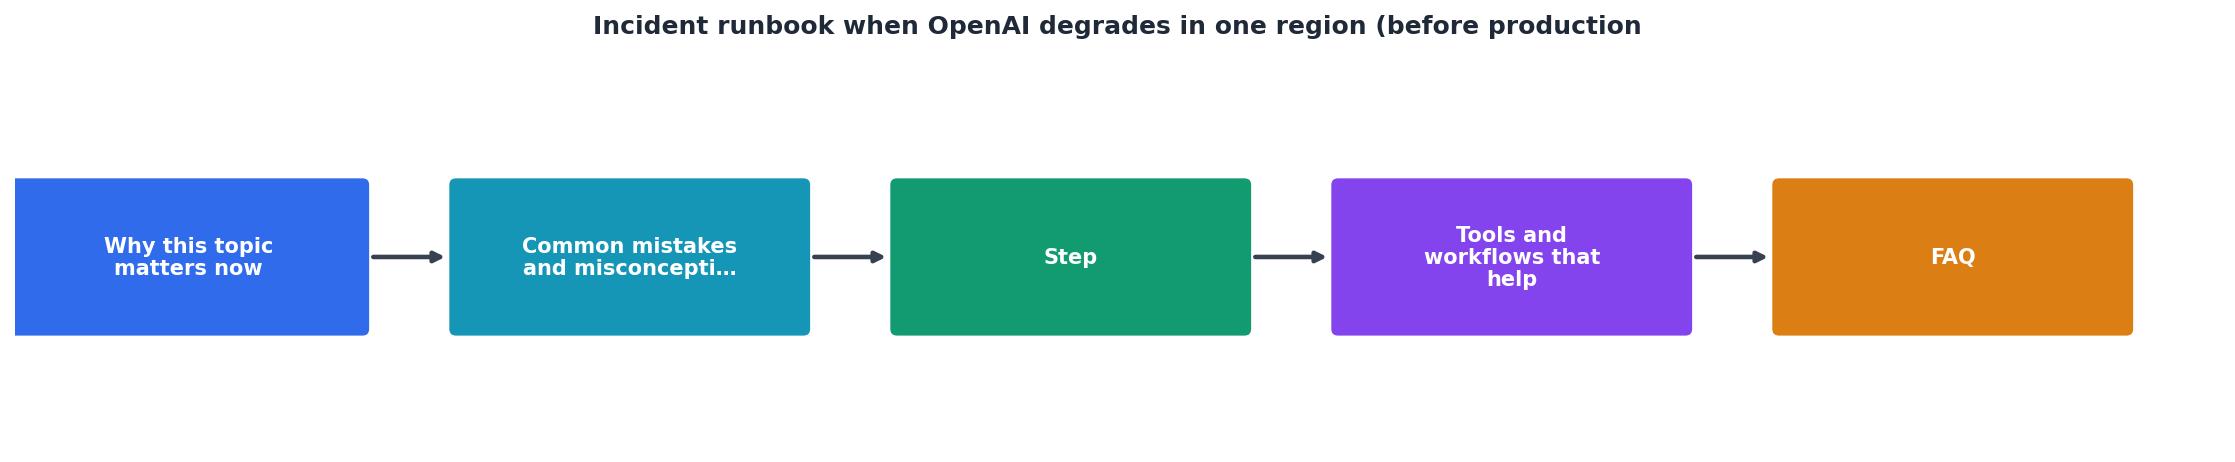
Phase 1, Detection
- Receive the alert. Observinio sends a degradation email or webhook when TTFB in a monitored region crosses your threshold. Note the exact timestamp, region identifier, observed latency value, and baseline value from the alert payload.
- Open the Observinio status page. Navigate to /status and confirm the spike is visible on the regional chart. Check whether adjacent regions (e.g.,
eu-west-2ifeu-west-1is degraded) show similar behavior. - Check OpenAI's own status page. Cross-reference with
status.openai.com. Provider pages often lag real-world degradation by 10–20 minutes, so do not wait for their confirmation to proceed.
Phase 2, Confirmation
- Run a manual probe. Execute a lightweight completion request from the affected region using your staging credentials. Measure TTFB with
curltiming or your SDK's built-in latency headers. Compare the result to the Observinio alert value.
# Example: measure TTFB for a short completion from eu-west-1
curl -o /dev/null -s -w "TTFB: %{time_starttransfer}s\nTotal: %{time_total}s\n" \
  -X POST https://api.openai.com/v1/chat/completions \
  -H "Authorization: Bearer $OPENAI_API_KEY" \
  -H "Content-Type: application/json" \
  -d '{"model":"gpt-4o","messages":[{"role":"user","content":"ping"}],"max_tokens":5}'
- Rule out your own stack. Check whether your load balancer, VPN, or DNS resolver in that region is misbehaving. A quick
tracerouteormtrto the OpenAI API endpoint can reveal network-level issues on your side. - Classify the incident. Use a simple decision tree:
- Latency elevated in one region only + other regions normal + your network healthy → Provider regional degradation.
- Latency elevated in multiple regions → Provider global degradation (different runbook).
- Latency elevated in one region + your network shows packet loss → Your infrastructure issue (escalate internally).
Phase 3, Communication
- Declare the incident. Post the pre-written template in your incident Slack channel. Include: region, observed TTFB, baseline TTFB, timestamp, and current classification.
- Page the escalation chain. If the degradation exceeds 3× baseline or persists beyond 10 minutes, page the ML platform lead and the SRE on-call via PagerDuty.
- Notify stakeholders. Send a brief update to the product manager and engineering leadership. In pre-production this is informational, but it sets the habit for post-cutover incidents where business decisions (e.g., delay a launch) may be needed.
Phase 4, Mitigation
- Activate failover. If your architecture supports it, reroute traffic from the degraded region to the nearest healthy region. For OpenRouter users, you can switch to an alternative provider endpoint via the OpenRouter provider page configuration.
- Throttle non-critical traffic. Reduce batch or background job traffic that hits the degraded region to free up quota for latency-sensitive requests.
- Monitor recovery. Keep the Observinio status page open and watch for TTFB to return within 1.5× baseline. Set a timer: if the degradation persists beyond 30 minutes, escalate to OpenAI support with your incident timeline and probe data.
Phase 5, Post-incident review
- Collect the timeline. Export Observinio's probe data for the affected region covering the incident window. Include alert timestamps, manual probe results, and failover activation time.
- Calculate MTTR. Time from first alert to mitigation (failover active). Time from first alert to full recovery (TTFB back to baseline). Record both.
- Run a blameless retrospective. Answer three questions: What did we detect well? Where did we lose time? What one change would cut MTTR the most?
- Update the runbook. Every incident teaches something. Maybe the threshold was too loose, the failover script needed a new environment variable, or the escalation contact list was outdated. Commit the changes to version control.
Adapting the runbook for OpenRouter traffic

If your staging environment routes through OpenRouter rather than hitting OpenAI directly, the runbook stays almost identical with two adjustments:
- Detection source changes. Observinio monitors both OpenRouter and OpenAI direct endpoints. Make sure your alert rules cover the correct provider path. Check /providers/openrouter for current regional data.
- Failover has more options. OpenRouter can route to multiple upstream providers. Your mitigation step can include switching models (e.g., from
openai/gpt-4otoanthropic/claude-sonnet-4) rather than just switching regions. Document the model fallback order in your runbook alongside the region fallback order.
Quick-reference: region failover pairs
| Primary region | Failover region | Notes |
|---|---|---|
us-east-1 | us-west-2 | Cross-coast, ~60 ms added |
eu-west-1 | eu-central-1 | Same continent, minimal latency penalty |
ap-southeast-1 | ap-northeast-1 | Singapore → Tokyo, ~40 ms added |
ap-south-1 | ap-southeast-1 | Mumbai → Singapore, ~50 ms added |
Common mistakes to avoid
- Waiting for the provider to confirm. OpenAI's status page can lag by 15+ minutes. Your own probes are the source of truth.
- Alerting on a single data point. One elevated probe can be a network hiccup. Require two or three consecutive breaches before triggering the runbook.
- Skipping the post-incident review in staging. "It's just staging" is exactly the attitude that leads to a chaotic first production incident. Treat every pre-production trigger as a rehearsal.
- Hardcoding failover targets. Regions that are healthy today may degrade tomorrow. Use dynamic selection based on the latest Observinio probe data rather than a static configuration.
- Forgetting to test the rollback. After failover, you need to route traffic back to the original region once it recovers. Test this path too, it is a common source of configuration drift.
Key takeaway: A pre-production incident runbook is not overhead — it is the single highest-leverage investment you can make before cutover. Rehearsing detection, escalation, and failover in staging builds the muscle memory that turns a 45-minute scramble into a 10-minute drill when real users are on the line.
Frequently Asked Questions
eu-west-1 baseline TTFB is 350 ms, set the alert at 700 ms. Tighten or loosen based on your application's latency budget. Observinio lets you configure per-region thresholds so you can account for naturally slower regions like af-south-1.Start rehearsing before it matters
The best time to discover a gap in your incident process is before production traffic depends on it. Observinio's daily probes across 21 regions, baseline comparisons, and email degradation alerts give you the detection layer this runbook requires, without building a custom synthetic monitoring stack. Set up your alerts on the Observinio status page, walk through the five phases above with your team, and turn your next staging spike from a surprise into a drill. If you have questions or want help configuring region-specific thresholds, reach out via /contact.
Ready to detect regional degradation before your users do?
Observinio monitors OpenAI and OpenRouter across 21 regions every day, giving you the per-region baselines and degradation alerts this runbook depends on.
View live status dashboard Get in touchAdditional Resources
- AI-Powered Major Incident Management - An effective runbook defines incident types, escalation paths, stakeholder roles, validation checkpoints, and post-incident learning procedures.
- The AI Incident Response Playbook: Diagnosing LLM ... - When your LLM feature degrades in production, standard SRE runbooks leave you blind. Here's the diagnosis tree, prompt rollback strategy, ...
- Multi-Region Failover: Strategies & Automated Runbooks - Learn how Cutover's automated runbooks orchestrate multi-region failover end-to-end - with a human in the loop where it matters.
Monitor AI API latency from 22 regions
Observinio runs daily probes against OpenRouter and OpenAI endpoints and emails you when latency degrades.
Set up alerts