Incident runbook when OpenAI degrades in one region (for design ops)
When OpenAI's API starts responding 3× slower from a single region, say eu-west-1, your design-ops pipeline does not crash loudly. Instead, Figma-to-code exports stall, copy-generation jobs queue up, and designers open a Slack thread titled "is the AI thing broken again?" By the time someone pages the platform team, the degradation has been silently eating productivity for an hour. This runbook gives you a repeatable, step-by-step process to detect, confirm, communicate, and resolve single-region OpenAI degradations before they snowball into cross-team incidents.

Photo by RDNE Stock project from Pexels
When OpenAI's API starts responding 3× slower from a single region, say eu-west-1, your design-ops pipeline does not crash loudly. Instead, Figma-to-code exports stall, copy-generation jobs queue up, and designers open a Slack thread titled "is the AI thing broken again?" By the time someone pages the platform team, the degradation has been silently eating productivity for an hour. This runbook gives you a repeatable, step-by-step process to detect, confirm, communicate, and resolve single-region OpenAI degradations before they snowball into cross-team incidents.
TL;DR
- Single-region OpenAI slowdowns are harder to catch than full outages because aggregate dashboards mask them.
- A structured runbook cuts mean-time-to-resolution (MTTR) by giving on-call engineers a deterministic decision tree instead of ad-hoc debugging.
- Use synthetic probes from multiple regions to confirm whether the issue is regional or global within the first five minutes.
- Communicate early and often through a dedicated status channel so design-ops stakeholders stop guessing.
- Observinio's 21-region daily probes and degradation alerts can trigger this runbook automatically, removing the human detection step entirely.
Why single-region degradations are uniquely dangerous

Most incident playbooks assume a binary state: the API is up or it is down. OpenAI's infrastructure, however, spans multiple Azure regions, and a degradation in one does not necessarily propagate to others. That asymmetry creates three problems for design-ops teams:
- Masked averages. If your monitoring aggregates TTFB across all regions, a 400 ms spike in
ap-southeast-1disappears inside a healthy 120 ms global mean. The dashboard stays green while your Singapore-based designers experience timeouts. - Intermittent failures. Regional degradations often manifest as elevated P95/P99 latency rather than hard errors. Retry logic succeeds on the second attempt, so error-rate alerts never fire, but throughput drops by 40 %.
- Blame ambiguity. Without regional data, the on-call engineer cannot tell whether the slowness originates at OpenAI, at the network path, or inside your own stack. Troubleshooting becomes a guessing game that burns 30–60 minutes of MTTR.
Prerequisites: what you need before the incident
Before you can execute this runbook, make sure the following pieces are in place:
- Regional synthetic probes. You need at least three geographically distributed probe points hitting the same OpenAI model endpoint you use in production. Observinio provides this out of the box from 21 global regions, but you can also supplement with your own cURL-based health checks.
- Baseline latency data. Without a baseline, you cannot define "degraded." Record P50, P95, and P99 TTFB for each region over a rolling 7-day window. Observinio's weekly summary emails give you exactly this data for every monitored endpoint.
- Alerting thresholds. Define what constitutes a degradation. A common starting point: P95 TTFB exceeds 2× the 7-day regional baseline for three consecutive probe cycles.
- Communication channel. A dedicated Slack channel (e.g.,
#design-ops-ai-status) where automated alerts post and where the on-call engineer updates stakeholders. - Escalation contacts. Know who owns the OpenAI account relationship and who can open a support ticket with OpenAI if needed.
Baseline threshold cheat sheet
| Metric | Healthy | Warning (1.5× baseline) | Degraded (2× baseline) | Critical (3× baseline) |
|---|---|---|---|---|
| P50 TTFB | ≤ 150 ms | ≤ 225 ms | ≤ 300 ms | > 300 ms |
| P95 TTFB | ≤ 350 ms | ≤ 525 ms | ≤ 700 ms | > 700 ms |
| P99 TTFB | ≤ 600 ms | ≤ 900 ms | ≤ 1 200 ms | > 1 200 ms |
| Error rate | < 0.5 % | < 1 % | < 3 % | ≥ 3 % |
The runbook: step by step
Detect & Acknowledge
0–5 min
Confirm Scope
5–15 min
Communicate
15–20 min
Mitigate
15–45 min
Monitor Recovery
45 min–2 h
Postmortem
Within 48 h
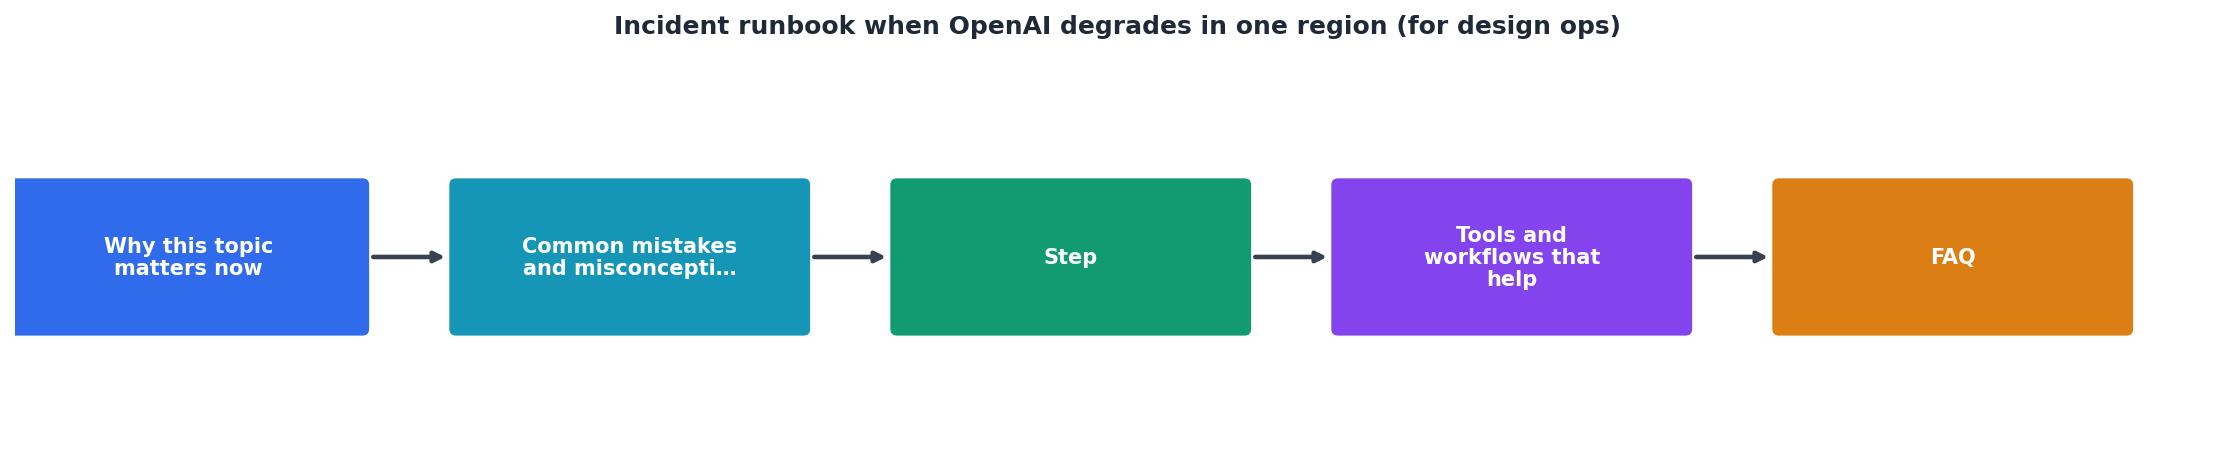
Step 1, Detect and acknowledge (0–5 min)
- Receive the alert. An Observinio degradation email or Slack webhook fires, indicating that TTFB from a specific region has crossed the warning threshold.
- Acknowledge within 5 minutes. The on-call engineer reacts with
:eyes:in the status channel and posts: "Investigating elevated latency from [REGION]. Stand by." - Open the Observinio status page at /status and confirm which region(s) show elevated latency. Note the exact timestamps and the magnitude of the spike.
Step 2, Confirm scope (5–15 min)
- Check other regions. On the Observinio dashboard, compare the affected region against at least two healthy regions. If all regions are degraded, escalate to the global-outage runbook instead.
- Run a manual probe. From a machine in or near the affected region, execute a timed API call:
curl -o /dev/null -s -w "TTFB: %{time_starttransfer}s\nTotal: %{time_total}s\n" \
  -X POST https://api.openai.com/v1/chat/completions \
  -H "Authorization: Bearer $OPENAI_API_KEY" \
  -H "Content-Type: application/json" \
  -d '{"model":"gpt-4o","messages":[{"role":"user","content":"ping"}],"max_tokens":1}'
- Compare TTFB to baseline. If the manual probe confirms latency ≥ 2× baseline, classify the incident as regional degradation, confirmed.
- Check OpenAI's status page (status.openai.com) for any posted incidents. Note: OpenAI often updates their status page 15–30 minutes after degradation begins, so absence of a posted incident does not rule out a real problem.
Step 3, Communicate (15–20 min)
- Post a structured update in
#design-ops-ai-status:
🟡 INCIDENT, Regional OpenAI Degradation
Region: ap-southeast-1
Impact: TTFB P95 at ~820 ms (baseline: 340 ms)
Affected workflows: batch copy generation, Figma-to-code export
Status: Confirmed, monitoring
Next update: 15 min
- Notify design-ops leads directly if batch jobs are currently running. They may choose to pause and wait rather than accumulate slow results.
- Open an internal incident ticket with severity level based on the threshold table above.
Step 4, Mitigate (15–45 min)
Depending on your architecture, choose one or more of these mitigations:
- Route traffic to a healthy region. If your stack supports regional routing (e.g., via OpenRouter or a custom proxy), shift requests from the degraded region to the nearest healthy one. Verify latency improves before committing the change.
- Reduce batch concurrency. Lower the parallelism of design-ops batch jobs to avoid overwhelming a degraded endpoint. Cutting concurrency from 20 to 5 often stabilizes P95 latency even during degradation.
- Switch to a fallback model. If the degradation is specific to a model (e.g.,
gpt-4o), consider temporarily routing to an alternative model that meets minimum quality requirements for the design-ops task. - Queue and retry. For non-urgent jobs, push requests into a queue with exponential backoff and process them once the region recovers.
"Our current estimates put monitoring overhead at roughly 20% of the inference compute being monitored, though the cost varies substantially across training and evaluation workloads.">, Pacing model development in an era of cyber
This quote underscores why external, lightweight monitoring, rather than heavy in-path instrumentation, is the preferred approach for tracking provider-side degradations. Synthetic probes from a service like Observinio add zero overhead to your production inference path.
Step 5, Monitor recovery (45 min–2 h)
- Watch the Observinio dashboard for the affected region's TTFB to return below the warning threshold for at least three consecutive probe cycles (typically 15 minutes each).
- Re-run the manual probe from Step 2 to double-check.
- Gradually restore traffic. If you rerouted in Step 4, shift 25 % of traffic back to the recovered region, wait 10 minutes, then shift the rest.
- Post an all-clear in the status channel:
🟢 RESOLVED, Regional OpenAI Degradation
Region: ap-southeast-1
Duration: ~1 h 15 min
Root cause: Provider-side (OpenAI confirmed elevated latency in AP region)
Follow-up: Postmortem scheduled for [DATE]
Step 6, Postmortem (within 48 h)
- Gather timeline data. Export Observinio probe logs for the incident window. Include TTFB charts for the affected region and at least one control region.
- Calculate impact. How many design-ops jobs were delayed? What was the total lost productivity in designer-hours?
- Identify detection gap. How long between degradation onset and first alert? If it was more than 5 minutes, tighten your alerting thresholds or add more probe regions.
- Document action items. Typical items include: adding a secondary routing path, lowering alert thresholds, or pre-configuring a fallback model for design-ops tasks.
Monitoring setup checklist

Use this checklist to verify your monitoring stack is ready to support the runbook:
Your progress is saved automatically in your browser.
Common pitfalls to avoid
- Relying solely on OpenAI's status page. Provider status pages are lagging indicators. By the time OpenAI posts an incident, your designers have already lost an hour. Synthetic probes give you a 10–30 minute head start.
- Alerting on global averages only. As discussed above, a single-region spike can hide inside a healthy global mean. Always alert per-region.
- Over-mitigating. Rerouting all traffic to another region can overload that region's capacity or introduce unexpected latency for users who were already well-served. Shift traffic incrementally.
- Skipping the postmortem. Regional degradations feel minor after they resolve. But without a postmortem, you miss the chance to tighten detection and reduce MTTR for the next occurrence, and there will be a next occurrence.
- Not testing the runbook. Run a tabletop exercise quarterly. Simulate a regional degradation alert and walk through every step. You will find stale contacts, broken webhook URLs, and missing permissions every single time.
FAQ
Frequently Asked Questions
Start catching regional degradations before your designers do
Setting up this runbook is half the battle, the other half is reliable detection. Observinio monitors OpenAI and OpenRouter endpoints from 21 global regions with daily probes, compares every measurement against rolling baselines, and sends you an email alert the moment a single region drifts. Pair that with the weekly summary for trend analysis, and you have a detection layer that triggers this runbook automatically. Check out the Observinio status page or get in touch to start your regional monitoring today.
Additional Resources
- Pacing model development in an era of cyber-critical ... - Immediately following the OpenAI-Hugging Face incident*, we paused frontier model inference in research clusters for runs that could execute ...
- Quick takes on the recent OpenAI public incident write-up - OpenAI recently published a public writeup for an incident they had on December 11, and there are lots of good details in here!
- Closing the Gap: 3 Metrics for AI Incident Response - Every engineering team has incident runbooks for infrastructure. Sudden spikes could mean model behavior shifted, or guardrail miscalibration, ...
Monitor AI API latency from 22 regions
Observinio runs daily probes against OpenRouter and OpenAI endpoints and emails you when latency degrades.
Set up alerts