Incident runbook when OpenAI degrades in one region (for solo developers)
You are a solo developer. It is 11 PM, your phone buzzes with a customer complaint about slow chat responses, and you have no SRE team to page. The problem turns out to be OpenAI latency spiking in a single region, not a global outage, not your code, just one geography behaving badly. Without a clear runbook you will waste an hour refreshing the OpenAI status page, guessing whether the issue is on your side, and wondering if you should reroute traffic.

You are a solo developer. It is 11 PM, your phone buzzes with a customer complaint about slow chat responses, and you have no SRE team to page. The problem turns out to be OpenAI latency spiking in a single region, not a global outage, not your code, just one geography behaving badly. Without a clear runbook you will waste an hour refreshing the OpenAI status page, guessing whether the issue is on your side, and wondering if you should reroute traffic. This guide gives you a step-by-step incident runbook you can follow alone, from the first alert to the postmortem note.
TL;DR
- Regional degradations are more common than full outages, TTFB can spike 3–5× in one region while others stay normal.
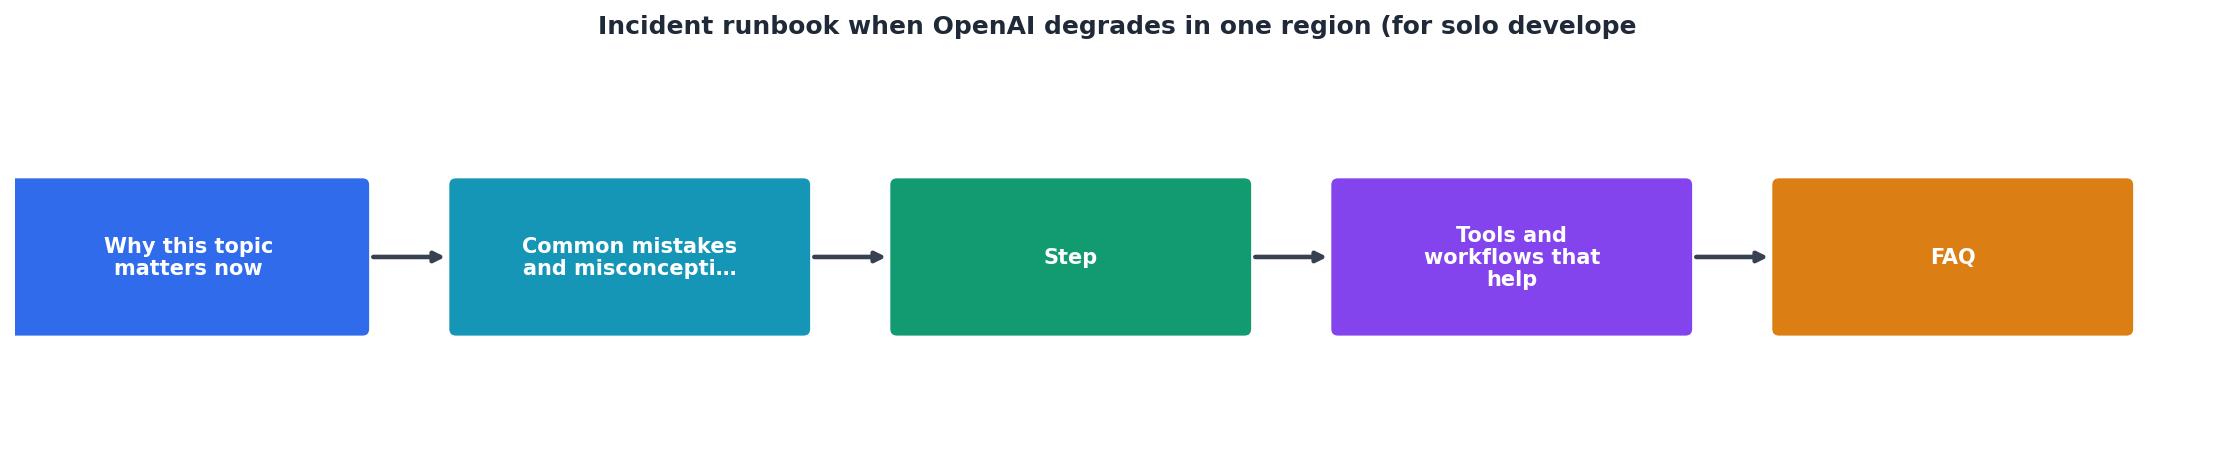
- A solo-developer runbook needs five phases: Detect → Confirm → Mitigate → Communicate → Review.
- Set up baseline-aware alerts so you know the difference between "slow today" and "slow for this region."
- Keep a pre-written status message and a one-click region failover ready before the incident happens.
- Observinio's 21-region probes and email alerts let you skip the manual confirmation step entirely.
Why regional degradations catch solo developers off guard

OpenAI routes inference requests through multiple data centers. When capacity in one region drops, due to hardware issues, traffic spikes, or rolling updates, latency in that region climbs while the rest of the world sees normal performance. The official status page often reports "All Systems Operational" because the degradation does not cross the global threshold.
For a solo developer this creates three problems:
- No internal signal. You do not have a fleet of canary pods reporting per-region p99 latency. Your first signal is usually a user complaint or your own gut feeling that "the app feels slow."
- Ambiguous root cause. Is it your server? Your database? The network hop between your cloud provider and OpenAI? Without regional baselines you cannot isolate the layer.
- No playbook. Large teams have incident commanders and communication templates. You have a Slack channel with yourself and maybe a co-founder who is asleep.
The five-phase solo incident runbook
Phase 1, Detect
The goal of this phase is to learn about the degradation before your users do. There are two practical approaches for a solo developer:
- Passive detection: You notice slow responses in your own app, or a customer emails you. This is the worst-case path, it means your monitoring gap is real.
- Active detection: An external probe service sends you an email or webhook the moment TTFB in a specific region exceeds its baseline by a defined threshold. Observinio runs daily probes from 21 regions and compares each measurement against historical baselines, so a spike in
us-east-1triggers an alert even ifeu-west-1is perfectly fine.
- Confirm you have at least one external latency alert configured for each region where you have significant users.
- Set the threshold relative to the baseline, not an absolute number. A 400 ms TTFB might be normal for
ap-southeast-1but a red flag forus-east-1. - Make sure the alert reaches a channel you actually check, email, SMS, or a push notification.
Phase 2, Confirm
Once you receive an alert (or a complaint), spend no more than five minutes confirming the scope. You need to answer two questions:
- Is it regional or global? Check latency from at least two other regions. If they are within baseline, the issue is regional.
- Is it OpenAI or my stack? Make a raw API call from a minimal script, no middleware, no database, no application logic. If the raw call is slow, the problem is upstream.
#!/usr/bin/env bash

MODEL="gpt-4o-mini"
START=$(date +%s%N)
curl -s -o /dev/null -w "%{time_starttransfer}" \
  -X POST https://api.openai.com/v1/chat/completions \
  -H "Authorization: Bearer $OPENAI_API_KEY" \
  -H "Content-Type: application/json" \
  -d "{\"model\":\"$MODEL\",\"messages\":[{\"role\":\"user\",\"content\":\"ping\"}],\"max_tokens\":1}"
echo ""
Run this from your server region and compare the time_starttransfer value against your known baseline. If it is 2× or more above normal, you have confirmed a provider-side degradation.
Alternatively, check the Observinio status page or the OpenAI provider view for a real-time regional breakdown, this saves you from writing any scripts at all.
Phase 3, Mitigate

You have confirmed a regional degradation. Now you need to reduce user impact. As a solo developer your options are limited but still meaningful:
- Route traffic to a healthy region. If your infrastructure supports it, shift the OpenAI API calls to a proxy or server in a region that is performing normally. Even a simple environment variable change (
OPENAI_API_BASEpointing to a different regional endpoint or a relay server) can help. - Fall back to a different model or provider. If you use OpenRouter, you may be able to switch to an alternative model that routes through different infrastructure. Prepare a fallback model identifier in your config ahead of time (e.g., swap from
openai/gpt-4otoopenai/gpt-4o-minior an Anthropic model). - Enable graceful degradation in your app. Show a "responses may be slower than usual" banner. Increase your client-side timeout so requests do not fail outright. Queue non-urgent requests for later processing.
- Do nothing (consciously). If the degradation is mild (TTFB up 30–40% but still under two seconds) and your user base is small, the correct mitigation might be to monitor and wait. Document this decision.
"Our current estimates put monitoring overhead at roughly 20% of the inference compute being monitored, though the cost varies substantially across training and evaluation workloads.">, Pacing model development in an era of cyber
This quote highlights an important nuance: monitoring itself has a cost. For solo developers, the goal is not to build a full observability platform but to rely on lightweight external probes that add zero overhead to your inference path.
Phase 4, Communicate
Even if you are a one-person team, you likely have users, a co-founder, or investors who care about uptime. Prepare these communication artifacts before an incident happens:
- Status page update template: "We are experiencing slower-than-usual AI responses for users in [REGION]. The issue is with our upstream provider. We are actively monitoring and have enabled fallback routing. ETA for resolution: tracking provider status."
- Customer reply template: "Thanks for reporting this. We have identified elevated latency from our AI provider in your region. Responses should still complete, but may take longer than usual. We are monitoring the situation and will update you when it resolves."
Phase 5, Review

Once the degradation resolves, spend 15–20 minutes on a lightweight postmortem. You do not need a formal document, a dated entry in a Markdown file or Notion page is enough. Answer these questions:
- Timeline: When did the degradation start? When were you alerted? When did you confirm? When did it resolve?
- Impact: How many users were affected? Did any requests fail outright or just slow down?
- Detection gap: How long between the start of the degradation and your first alert? If this gap was more than 15 minutes, your monitoring needs improvement.
- Mitigation effectiveness: Did your failover work? How long did it take to activate?
- Action items: What will you change before the next incident? Common items include adding a new region to your alert configuration, pre-staging a failover script, or subscribing to Observinio's weekly latency summaries to spot trends before they become incidents.
Pre-incident preparation checklist
Do not wait for an incident to prepare. Complete these items on a quiet afternoon:
Your progress is saved automatically in your browser.
Common mistakes solo developers make during regional incidents
Avoiding these pitfalls will save you time and stress:
- Assuming it is your code first. When latency spikes, the instinct is to check your recent deployments. If you have not deployed in the last few hours, check the provider first.
- Waiting for the official status page. Provider status pages often lag behind real-world degradations by 15–45 minutes. External probes catch issues faster.
- Over-engineering the failover. You do not need a multi-cloud Kubernetes mesh. A simple
if region_latency > threshold then use_fallback_endpointin your application code is enough for most solo projects. - Forgetting to revert. After the incident resolves, make sure you switch back from your fallback configuration. Running on a fallback model indefinitely can affect response quality or cost.
- Skipping the postmortem. It takes 15 minutes and prevents you from making the same mistake twice. Write it down.
Bookmark this runbook and keep your quick-probe.sh script, fallback provider key, and status-page templates within one click of your terminal. When the next regional spike hits, open this page, follow the five phases, and resolve the incident before most of your users even notice.
Frequently Asked Questions
curl request from your server and compare against your recorded baseline.eu-west-1 baseline TTFB is 350 ms, set a warning at 700 ms and a critical alert at 1050 ms. Adjust these thresholds after a few weeks of data collection.Stay ahead of the next regional degradation
You do not need a full SRE team to handle regional OpenAI degradations gracefully, you need a runbook, pre-staged failover configs, and alerts that understand regional baselines. Observinio monitors OpenAI and OpenRouter endpoints from 21 global regions, compares every probe against historical baselines, and sends you an email alert when latency in any region drifts beyond your threshold. Set up alerts on the Observinio status page so the next regional spike is something you handle in five minutes, not something you discover from an angry customer email.
Additional Resources
- Pacing model development in an era of cyber-critical ... - Immediately following the OpenAI-Hugging Face incident*, we paused frontier model inference in research clusters for runs that could execute ...
- Quick takes on the recent OpenAI public incident write-up - In the OpenAI incident, it was the Kubernetes API servers saturated because they were receiving too much traffic. Once that happened, the API ...
- OpenAI Pauses AI Development After Security Incident - OpenAI found more evidence its agents ran amok unsupervised. The pattern is consistent: give an agent a goal, remove the checkpoint, and it ...
Monitor AI API latency from 22 regions
Observinio runs daily probes against OpenRouter and OpenAI endpoints and emails you when latency degrades.
Set up alerts