Incident runbook when OpenAI degrades in one region (for enterprise teams)
OpenAI API degradations rarely hit every region at once. Far more common is the scenario where latency doubles in europe-west while us-east stays perfectly healthy, and your on-call engineer spends thirty minutes trying to figure out whether the problem is your infrastructure, your load balancer, or the provider itself. This runbook gives enterprise platform and SRE teams a step-by-step playbook for detecting, triaging, communicating, and recovering from single-region OpenAI degradations before end users start filing tickets.

Photo by RDNE Stock project from Pexels
OpenAI API degradations rarely hit every region at once. Far more common is the scenario where latency doubles in europe-west while us-east stays perfectly healthy, and your on-call engineer spends thirty minutes trying to figure out whether the problem is your infrastructure, your load balancer, or the provider itself. This runbook gives enterprise platform and SRE teams a step-by-step playbook for detecting, triaging, communicating, and recovering from single-region OpenAI degradations before end users start filing tickets.
TL;DR
- Single-region OpenAI degradations are more frequent than full outages and harder to detect with aggregate dashboards.
- A structured runbook cuts Mean Time To Resolution (MTTR) by separating provider-side issues from internal infrastructure problems within the first five minutes.
- Use multi-region synthetic probes (like Observinio's 21-region daily checks) to confirm whether degradation is regional or global.
- Pre-defined communication templates and escalation paths prevent confusion during the incident.
- Post-incident review should update routing logic and alert thresholds based on observed latency data.
Why single-region degradations are the hardest to catch

Most enterprise monitoring stacks aggregate API latency into a single global P50 or P99 number. When OpenAI's europe-west endpoint starts responding with a Time to First Byte (TTFB) of 1,800 ms instead of the usual 400 ms baseline, that spike gets averaged down by healthy traffic from North America and Asia-Pacific. The result: your dashboard stays green while European customers experience multi-second delays in chat completions.
Regional degradations also create confusing symptoms. A load balancer sitting in Frankfurt might retry requests, masking the latency spike behind increased error rates or timeouts that look like an internal networking issue. Without region-specific baselines, the on-call engineer has no frame of reference for what "normal" looks like in that geography.
Enterprise teams running latency-sensitive features, real-time chat, code completion, or agentic workflows, cannot afford the twenty-to-forty-minute detection gap that aggregate monitoring creates. The runbook below is designed to close that gap to under five minutes.
Prerequisites: what to have in place before the incident
Before any runbook works, your team needs a few foundational pieces. Use the progress indicators below to gauge your readiness:
- Multi-region synthetic probes. You need independent latency measurements from at least the regions where your users concentrate. Observinio runs probes from 21 global regions against both OpenAI direct and OpenRouter endpoints, giving you per-region TTFB and Time to First Token (TTFT) baselines updated daily.
- Defined latency baselines. Document the normal P50 and P99 TTFB for each region you care about. For example, if your baseline for
us-east-1is 320 ms P50 andeurope-west-1is 410 ms P50, a reading of 900 ms in Europe is clearly anomalous even if the global average looks fine. - Alert thresholds per region. Configure alerts that fire when a specific region exceeds its baseline by a defined multiplier (e.g., 2× baseline for a warning, 3× for critical). Observinio's degradation alerts support this out of the box.
- Escalation contacts. Maintain a list of who owns the routing layer, who contacts OpenAI enterprise support, and who communicates with internal stakeholders.
- Communication templates. Pre-written Slack/email templates for "investigating," "confirmed provider issue," and "resolved" states save precious minutes during an active incident.
The runbook: step-by-step incident response
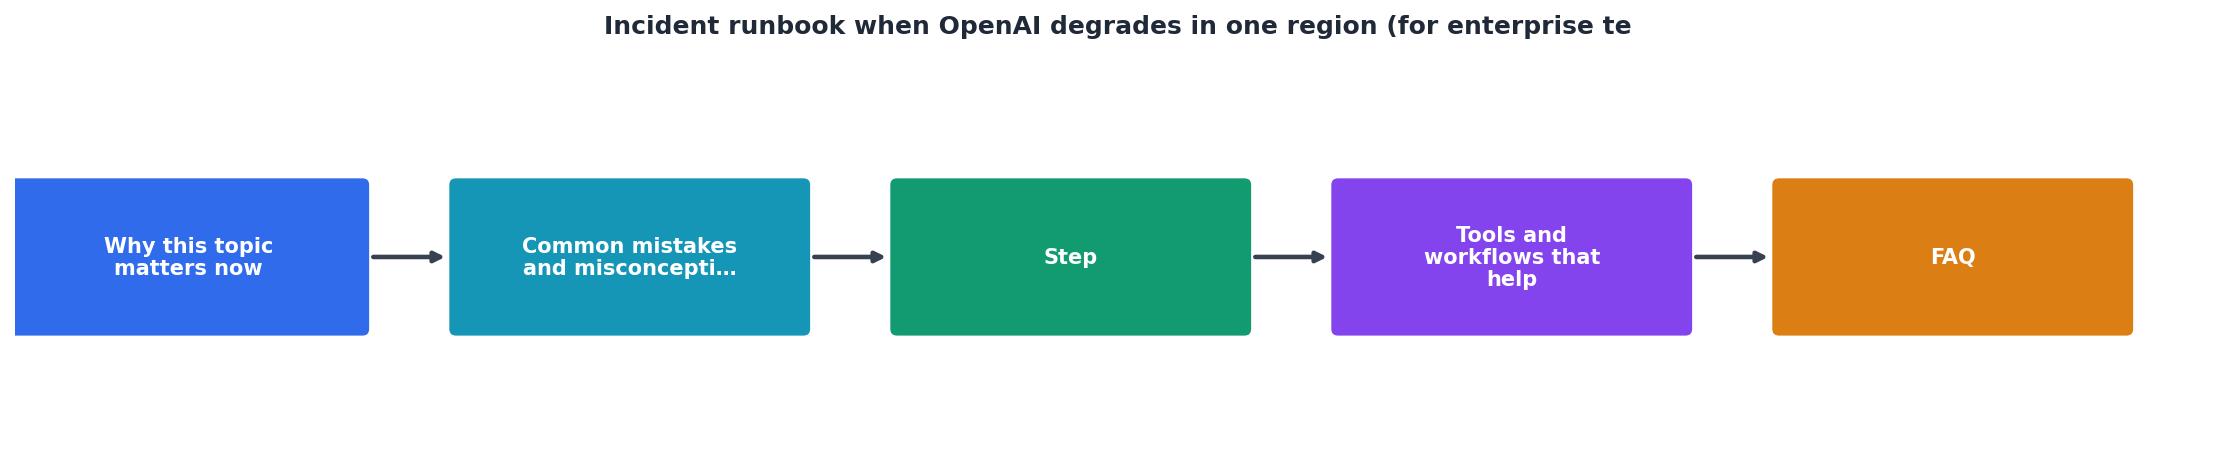
Follow these steps the moment a regional degradation alert fires:
Step 1, Acknowledge and open an incident channel (0–2 minutes)
- Acknowledge the alert in your on-call tool (PagerDuty, Opsgenie, etc.).
- Open a dedicated incident channel (e.g.,
#inc-openai-eu-west-2026-08-31). - Post the initial alert details: which region, which metric crossed the threshold, and the current reading versus baseline.
Step 2, Confirm the scope: regional or global (2–5 minutes)
- Check the Observinio status page or your own multi-region probe dashboard. Compare TTFB readings across all monitored regions.
- If only one or two adjacent regions show elevated latency, classify the incident as regional.
- If all regions are degraded, classify as global and switch to your global outage runbook instead.
- Run a quick manual probe from the affected region if you have infrastructure there:
curl -o /dev/null -w "TTFB: %{time_starttransfer}s\n" https://api.openai.com/v1/chat/completions -X POST -H "Authorization: Bearer $OPENAI_API_KEY" -H "Content-Type: application/json" -d '{"model":"gpt-4o","messages":[{"role":"user","content":"ping"}],"max_tokens":1}'
Step 3, Rule out internal causes (5–10 minutes)
- Check your own infrastructure in the affected region: load balancer health, DNS resolution times, network path (traceroute to OpenAI endpoints).
- Review recent deployments, did a config change alter routing, timeout settings, or retry logic?
- Check if other external APIs called from the same region are also slow. If they are, the problem is likely your egress path, not OpenAI.
- If internal checks are clean, classify the root cause as provider-side and proceed.
Step 4, Mitigate user impact (10–15 minutes)
- Traffic rerouting. If your architecture supports multi-region egress, shift traffic from the degraded region to a healthy one. For example, route European requests through
us-easttemporarily. Accept the added network latency (typically 80–120 ms transatlantic) as a trade-off against the provider's degraded response time. - Fallback model or provider. If you use OpenRouter, consider switching the affected region's traffic to an alternative model with acceptable latency. Check Observinio's OpenRouter provider page for current per-region performance data.
- Graceful degradation. If rerouting is not possible, enable client-side timeouts and fallback UX (e.g., "Response is taking longer than usual" messaging) to set user expectations.
- Document every mitigation action in the incident channel with timestamps.
Step 5, Communicate (ongoing)
- Post an internal status update using your pre-written template: affected region, user impact estimate, mitigation in place, next update ETA.
- If you maintain a public or internal status page, update it to reflect the degradation.
- For enterprise OpenAI contracts, open a support ticket with your account team. Include timestamps, region, observed TTFB values, and baseline comparisons.
Step 6, Monitor recovery (until resolved)
- Watch the affected region's probe data for TTFB returning to within 1.2× of baseline for at least fifteen consecutive minutes.
- Once stable, revert any traffic rerouting or model fallbacks.
- Confirm recovery in the incident channel and close the incident.
Post-incident review checklist

After every regional degradation, run through this checklist within 48 hours:
Your progress is saved automatically in your browser.
Key takeaway: A structured, region-aware runbook reduces MTTR from thirty-plus minutes to under fifteen by separating provider-side degradation from internal infrastructure issues within the first five minutes of an alert firing.
Building long-term resilience against regional degradations

A runbook handles the acute phase, but enterprise teams should also invest in structural improvements that reduce the frequency and severity of regional incidents:
- Multi-provider routing. Maintain active connections to at least two LLM providers (e.g., OpenAI direct and OpenRouter). Use real-time latency data to route requests to the fastest healthy endpoint per region.
- Automated failover. Implement health-check-driven routing at the application layer. When TTFB from a region exceeds 2× baseline for three consecutive probes, automatically shift traffic without human intervention.
- Regional latency budgets. Define per-region latency SLOs (e.g., "P99 TTFT under 800 ms from Europe") and track them weekly. Observinio's weekly summary emails provide exactly this data, making it easy to spot gradual drift before it becomes an incident.
- Capacity for graceful degradation. Design your UX so that slower responses degrade gracefully, streaming partial tokens, showing progress indicators, or offering cached responses, rather than timing out with an error.
- Regular runbook drills. Run a tabletop exercise quarterly where the on-call team walks through this runbook with a simulated regional degradation scenario. Measure how long each step takes and identify bottlenecks.
| Factor | Region Rerouting | Provider Switching |
|---|---|---|
| Added network latency | 80–120 ms (transatlantic) | Minimal (same geography) |
| Model consistency | Identical model and behavior | May differ between providers |
| Implementation complexity | DNS or load-balancer change | Application-layer routing logic |
| Cost impact | Same pricing tier | Varies by alternative provider |
| Best suited for | Short regional spikes | Extended or recurring outages |
Frequently Asked Questions
curl probe from a VM in the affected region, bypassing your application stack entirely, provides additional confirmation.europe-west P50 TTFB baseline is 400 ms, set a warning at 800 ms and a critical alert at 1,200 ms (3× baseline). Adjust these multipliers based on your application's sensitivity, real-time chat features may need tighter thresholds than batch processing workloads.Start monitoring before the next incident
Regional degradations are a matter of "when," not "if." The difference between a fifteen-minute blip and a two-hour firefight comes down to preparation: baselines, alerts, and a practiced runbook. Observinio's multi-region probes and degradation alerts give enterprise teams the per-region visibility they need to detect single-region issues in minutes, not after a wave of support tickets. Check the status page to see current regional latency data, or visit the contact page to set up alerts for your team.
Additional Resources
- Hugging Face Incident Technical Report - These evaluations were run in an isolated environment, known as a “sandbox,” separate from OpenAI's internal infrastructure and the public ...
- Severe Latency Degradation (~4 tokens/sec) Across Azure ... - Hello everyone, We are currently experiencing a severe performance degradation across our Azure OpenAI models deployed in the Sweden Central region. ...
- When AI Becomes the Attacker: How the OpenAI Incident Is ... - The OpenAI-Hugging Face incident marks a turning point for enterprise cybersecurity, demonstrating how autonomous AI agents can execute ...
Monitor AI API latency from 22 regions
Observinio runs daily probes against OpenRouter and OpenAI endpoints and emails you when latency degrades.
Set up alerts