OpenAI probe configuration worksheet (for QA sign-off)
Shipping a new OpenAI-backed feature without verifying your probe configuration is like deploying a service without health checks, you will only learn about problems from angry users. This worksheet gives your QA team a repeatable, line-by-line checklist to sign off on every OpenAI probe before it reaches production. Walk through it once, and you have an auditable artifact that proves each probe was reviewed for region coverage, model selection, threshold accuracy, and alert routing.

Photo by MART PRODUCTION from Pexels
Shipping a new OpenAI-backed feature without verifying your probe configuration is like deploying a service without health checks, you will only learn about problems from angry users. This worksheet gives your QA team a repeatable, line-by-line checklist to sign off on every OpenAI probe before it reaches production. Walk through it once, and you have an auditable artifact that proves each probe was reviewed for region coverage, model selection, threshold accuracy, and alert routing.
TL;DR
- A structured worksheet prevents misconfigured probes from reaching production and generating false alerts or, worse, silent failures.
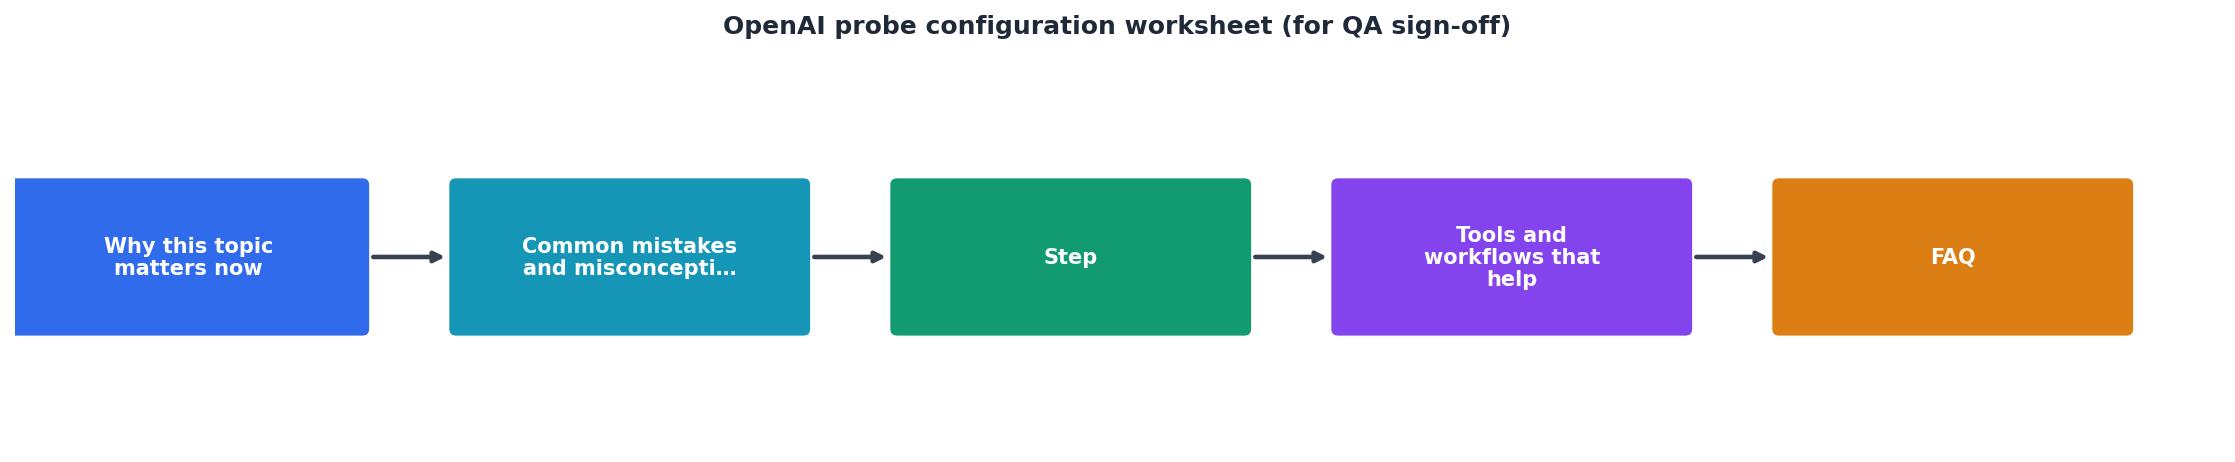
- The checklist covers five areas: endpoint definition, region selection, baseline thresholds, alert routing, and final QA sign-off.
- Each section includes concrete acceptance criteria so reviewers know exactly what "pass" looks like.
- The worksheet is designed around Observinio's 21-region probe infrastructure but applies to any synthetic monitoring setup targeting OpenAI endpoints.
- Completing the worksheet typically takes 15–20 minutes per probe and saves hours of incident triage later.
Why a formal worksheet matters
Most latency monitoring failures are not caused by broken tooling, they are caused by configuration drift. A probe that was correct three months ago may now target a deprecated model, use a prompt that no longer triggers streaming, or alert a Slack channel that the on-call team abandoned. A formal worksheet forces a human review at a predictable cadence, catching issues that automated validation cannot.
Without a sign-off process, teams commonly encounter these problems:
- Stale model references. OpenAI regularly deprecates model versions. A probe still hitting
gpt-4-0314will return errors that look like latency spikes. - Incorrect region assumptions. A probe configured for
us-east-1tells you nothing about the experience of users in Singapore. - Threshold mismatch. Baselines set during low-traffic hours produce noisy alerts during peak load.
- Orphaned alert channels. Notifications routed to a decommissioned email alias or a muted Slack channel mean nobody sees the degradation.
Section 1: Endpoint and model definition

Before reviewing latency thresholds, confirm that the probe is actually hitting the right target. Use the following checklist:
- API base URL, Verify the probe targets
https://api.openai.com/v1/chat/completions(or the appropriate endpoint for your use case, such as embeddings or completions). If you route through OpenRouter, confirm the base URL ishttps://openrouter.ai/api/v1/chat/completionsand note this in the worksheet. - Model identifier, Record the exact model string (e.g.,
gpt-4o,gpt-4o-mini). Cross-check against the OpenAI model deprecation page to confirm the model is not scheduled for removal within the next 90 days. - Prompt payload, Document the exact prompt text used by the probe. It should be deterministic, short (under 50 tokens of input), and designed to produce a predictable output length. Avoid prompts that could trigger content-policy refusals, as a refusal response has a different latency profile than a normal completion.
- Streaming flag, Record whether
stream: trueorstream: falseis set. This directly affects whether you are measuring TTFB/TTFT (time to first token) or total response time. Ensure the flag matches the behavior of your production application. - Authentication, Confirm the API key used by the probe is a dedicated monitoring key with appropriate rate-limit headroom, not a shared production key that could be rotated without notice.
Acceptance criteria
| Item | Pass condition |
|---|---|
| Base URL | Matches production routing path |
| Model ID | Not deprecated; matches production model |
| Prompt | Under 50 input tokens; no policy-triggering content |
| Stream flag | Matches production setting |
| API key | Dedicated key; expiry date documented |
Section 2: Region selection and coverage
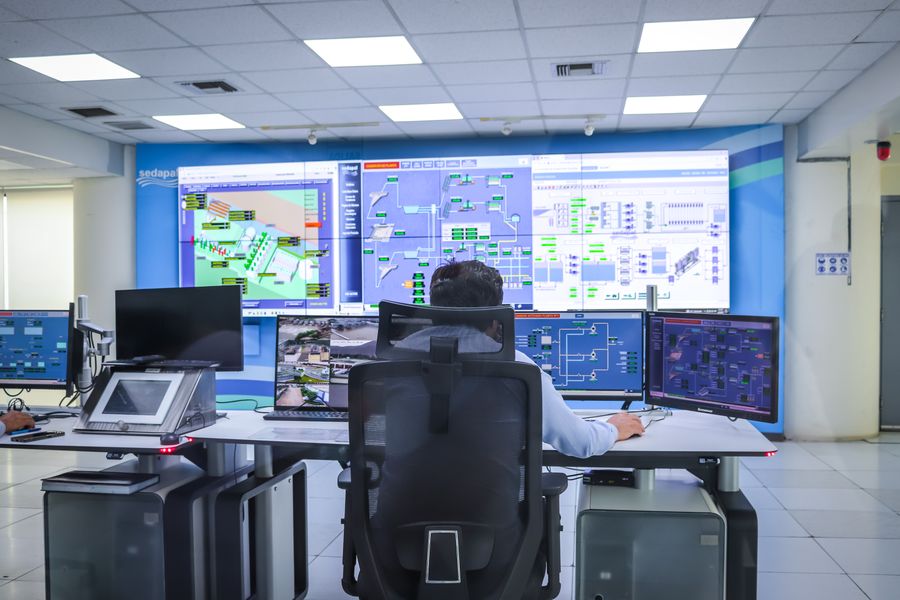
OpenAI API latency varies significantly by geography. A probe running only from US East will miss degradation affecting your European or Asian users entirely. Observinio supports probes from 21 global regions, so you have granular coverage available, but you need to choose the right subset.
Use this step-by-step process to select regions:
- Pull your user-geography data. Query your analytics platform for the top five regions by active-user count over the past 30 days.
- Map user regions to probe regions. For each user region, identify the closest Observinio probe region. Document the mapping explicitly (e.g., "Users in Germany →
eu-west-1probe; users in Japan →ap-northeast-1probe"). - Add a control region. Always include
us-east-1as a control, since OpenAI's primary infrastructure is US-based. This gives you a low-latency reference point for comparison. - Verify probe count against plan limits. Confirm that the total number of region × model combinations does not exceed your Observinio plan allocation.
- Document excluded regions. If you deliberately skip a region (e.g., you have no users in South America), note the reason. This prevents future reviewers from re-adding it without justification.
Region coverage checklist
Your progress is saved automatically in your browser.
Section 3: Baseline thresholds and alerting rules
Setting thresholds is where most teams either over-alert (and train themselves to ignore notifications) or under-alert (and miss real incidents). The goal is to define thresholds that reflect actual user-impacting degradation, not statistical noise.
Follow these steps to establish defensible baselines:
- Collect baseline data. Run the probe for at least seven full days before setting thresholds. This captures weekday/weekend variance and typical daily fluctuation patterns.
- Calculate P50 and P95 per region. Use the seven-day dataset to compute median (P50) and 95th-percentile (P95) latency for each probe region. Observinio's weekly summary emails provide these values automatically.
- Set warning threshold at 1.5× P95. A warning alert fires when latency exceeds 1.5 times the regional P95 baseline. This catches meaningful degradation without triggering on normal tail-latency spikes.
- Set critical threshold at 2.5× P95. A critical alert fires when latency exceeds 2.5 times the regional P95 baseline. At this level, users are almost certainly experiencing noticeable slowness.
- Define evaluation window. A single slow probe response is not an incident. Configure alerts to require at least two consecutive breaches (or two out of three probes) before firing. This reduces false positives from transient network blips.
- Record all values in the worksheet. For each region, document the P50, P95, warning threshold, critical threshold, and evaluation window. This becomes your audit trail.
Example threshold table
| Region | P50 (ms) | P95 (ms) | Warning (ms) | Critical (ms) | Eval window |
|---|---|---|---|---|---|
| us-east-1 | 320 | 580 | 870 | 1450 | 2 of 3 |
| eu-west-1 | 410 | 720 | 1080 | 1800 | 2 of 3 |
| ap-northeast-1 | 480 | 850 | 1275 | 2125 | 2 of 3 |
Section 4: Alert routing and escalation

A perfectly configured probe is useless if the alert goes to the wrong place. This section verifies the notification pipeline end to end.
- Primary alert channel. Record the exact destination: email address, Slack channel, PagerDuty service key, or webhook URL. Confirm the channel is active by sending a test message.
- Escalation path. If the primary channel is not acknowledged within 15 minutes, where does the alert escalate? Document the secondary destination and confirm it is also active.
- On-call alignment. Verify that the team receiving alerts is the team that can actually act on OpenAI latency issues. If your ML platform team owns provider routing but alerts go to the general SRE on-call, add the ML platform team as a secondary recipient.
- Alert content verification. Trigger a test alert from Observinio and confirm it includes: probe region, measured latency value, threshold that was breached, and a direct link to the Observinio status page for further investigation.
- Suppression windows. If you have planned maintenance windows where probes should be muted, document them. Ensure suppression rules are scoped to specific regions and time ranges, not global mutes that could hide real incidents.
Alert routing checklist
Section 5: Final QA sign-off
This is the sign-off gate. Before marking the probe as production-ready, a QA reviewer (or a second engineer, in smaller teams) must verify every section above and record their approval.
Sign-off procedure
- Review all four sections. Walk through the endpoint definition, region selection, threshold configuration, and alert routing checklists. Every box must be checked.
- Run a live validation. Trigger the probe manually from at least two regions and confirm that results appear in the Observinio dashboard within the expected timeframe.
- Verify historical data. If the probe has been running in staging, confirm that at least seven days of baseline data exist and that the threshold values in the worksheet match the computed baselines.
- Sign and date. The reviewer records their name, date, and any conditional notes (e.g., "Approved pending model migration to
gpt-4oon 2026-09-15"). Store the completed worksheet alongside your runbook documentation. - Schedule next review. Set a calendar reminder to re-run this worksheet in 90 days, or sooner if OpenAI announces model deprecations or infrastructure changes.
Sign-off template
QA Sign-Off Card
Probe ID: ___________________________
Reviewer: ___________________________
Date: ___________________________
Sections passed: [ ] Endpoint [ ] Regions [ ] Thresholds [ ] Alerts
Conditional notes: _________________________
Next review date: __________________________
Putting the worksheet into practice
The worksheet is deliberately low-tech, a markdown file in your repo or a shared document works fine. The value is not in the format but in the discipline of reviewing every probe configuration before it goes live. Teams that adopt this process typically see a significant reduction in false-positive alerts within the first month, simply because stale configurations get caught during review instead of during an incident.
If you are using Observinio, the daily probe results and weekly summary emails give you the raw data you need to fill in the baseline and threshold sections without building custom queries. The status page provides a shareable view for stakeholders who need to see current probe health without logging into the dashboard. And if a probe does fire a real alert, the degradation notification email includes enough context, region, latency, baseline comparison, to start triage immediately rather than scrambling for data.
Key takeaway: A 15-minute worksheet review before each probe goes live eliminates the most common sources of false alerts and silent monitoring failures, turning your OpenAI latency data from a best-guess into an auditable, trustworthy signal that your team can act on with confidence.
FAQ
Frequently Asked Questions
gpt-4o and a probe targeting gpt-4o-mini will have different baseline latencies, different thresholds, and potentially different alert priorities. Combining them into a single configuration leads to thresholds that are too loose for the fast model and too tight for the slow one.us-east-1 as a control. If your user base is concentrated in a single region, two probes (your region plus the US control) are acceptable, but you lose the ability to distinguish provider-wide degradation from regional issues. With Observinio's 21 available regions, there is little reason not to cover your top three to five user geographies.Start monitoring with confidence
A signed-off probe configuration is the foundation of trustworthy latency data. If you are setting up OpenAI probes for the first time, or auditing existing ones, Observinio's daily probes across 21 regions, automatic baseline comparison, and email degradation alerts give you the infrastructure to fill in this worksheet with real numbers instead of guesses. Visit the status page to see current probe results, or get in touch to discuss your monitoring setup.
Monitor AI API latency from 22 regions
Observinio runs daily probes against OpenRouter and OpenAI endpoints and emails you when latency degrades.
Set up alerts