OpenAI probe configuration worksheet (for stakeholder demos)
When you deploy LLM features into production, latency is not an abstract metric, it directly impacts user experience, operational costs, and your ability to stand behind SLOs. Monitoring OpenAI API response times from multiple regions gives you early warning of degradation, evidence for routing decisions, and the data you need to convince leadership that infrastructure investments matter. This worksheet walks platform engineers, SREs, and CTOs through setting up synthetic probes for OpenAI endpoints, configuring alerts, and presenting findings to non-technical stakeholders.

Photo by MART PRODUCTION from Pexels
When you deploy LLM features into production, latency is not an abstract metric, it directly impacts user experience, operational costs, and your ability to stand behind SLOs. Monitoring OpenAI API response times from multiple regions gives you early warning of degradation, evidence for routing decisions, and the data you need to convince leadership that infrastructure investments matter. This worksheet walks platform engineers, SREs, and CTOs through setting up synthetic probes for OpenAI endpoints, configuring alerts, and presenting findings to non-technical stakeholders.
Key takeaway: Synthetic probes from 21 global regions, paired with degradation alerts and SLO-based thresholds, enable you to detect OpenAI API latency issues hours before end-users complain, reducing incident response time and justifying monitoring investment to leadership.TL;DR
- Set up daily probes from 21+ global regions to catch latency anomalies before users notice.
- Monitor both time-to-first-byte (TTFB) and time-to-full-token (TTFT) to see regional variance and model-specific bottlenecks.
- Use Observinio's degradation alerts to page on-call when latency crosses your SLO threshold.
- Build a simple weekly report (max two graphs) showing trend and region breakdown to justify monitoring investment to executives.
- Test your probe configuration during business hours with non-production API keys to validate alerts fire correctly.
Why probe OpenAI directly?

Most APM tools measure latency within your infrastructure. They capture how long a request takes from your app to your database, or how long a Lambda function runs. What they miss is the round-trip time to OpenAI's API servers, especially when those servers are distributed globally and your end-users are spread across regions.
A user in Singapore making a request routed through a US data center will see higher latency than a user in Virginia. OpenAI's infrastructure handles this fairly well, but regional variance still exists. Without direct probes, you only learn about slowness when your support team reports it or your application dashboards show elevated API call duration.
Observinio solves this by running synthetic probes from 21 global regions on a schedule you control (typically daily). Each probe measures:
- Time-to-First-Byte (TTFB): How long until OpenAI's first response token arrives. This reflects network latency, routing, and initial model load time.
- Time-to-Full-Token (TTFT): How long until the entire completion is streamed back. This captures model inference latency and token generation speed.
- HTTP status and error rate: Whether the endpoint is returning 200 OK, 429 rate-limits, or 5xx server errors.
- "Is our chat feature slow in EMEA regions?"
- "Did OpenAI's performance degrade after their last update?"
- "Should we switch to a faster model or a different provider?"
Setting up your baseline configuration
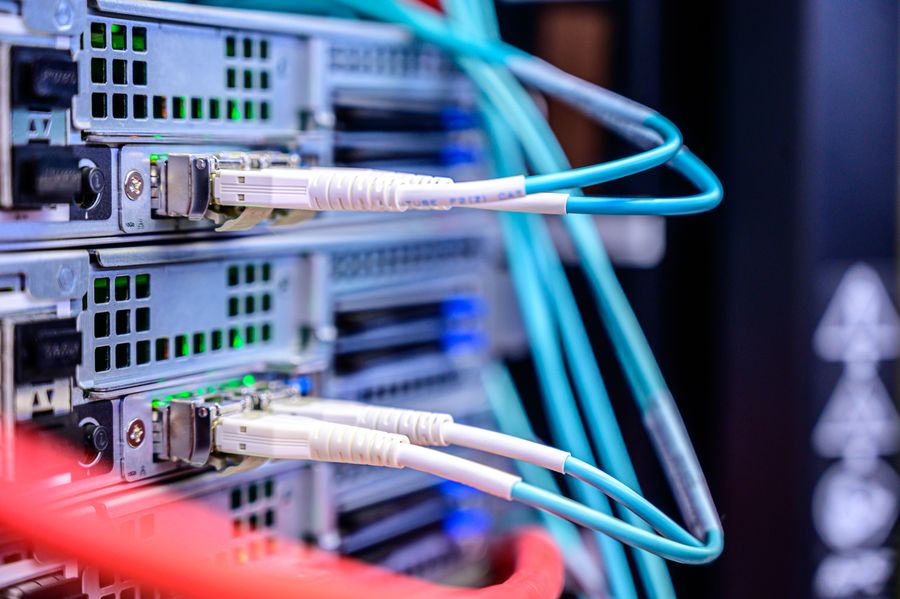
Before configuring probes, decide what you want to measure. Start with a single, representative OpenAI endpoint and a simple payload:
Probe configuration checklist
Your progress is saved automatically in your browser.
Sample minimal probe request
POST https://api.openai.com/v1/chat/completions
Authorization: Bearer sk-...
Content-Type: application/json

{
  "model": "gpt-3.5-turbo",
  "messages": [{"role": "user", "content": "Confirm you are ready."}],
  "max_tokens": 5,
  "temperature": 0.5
}
This request costs under $0.001 per probe and trains your monitoring to watch for real-world behavior: network flakiness, rate-limit headers, and inference speed.
"The SOC email template context output (replace_existing=True, running twice overwrites the previous draft).">, OpenAI GPT
Configuring degradation alerts
Once your baseline probes run for 3–7 days, Observinio learns what "normal" latency looks like for each region. You can then set threshold-based or anomaly-based alerts:
Alert threshold strategy
- TTFB SLO: Set to 1.5× your observed baseline. If baseline is 300 ms, alert at 450 ms.
- TTFT SLO: Set to 2× your baseline (inference is slower than TTFB). If baseline is 2 seconds, alert at 4 seconds.
- Error rate: Alert if any region returns >5% errors in a day.
- Consecutive failures: Alert if 2+ probes from the same region fail in a row (indicates a real problem, not a blip).
Alert action plan
- Email your on-call engineer immediately.
- Post a Slack message to #observability with the region, latency value, and link to the Observinio status page.
- Include a link to your playbook for "OpenAI latency spike" (see FAQ for template).
Building a stakeholder demo report
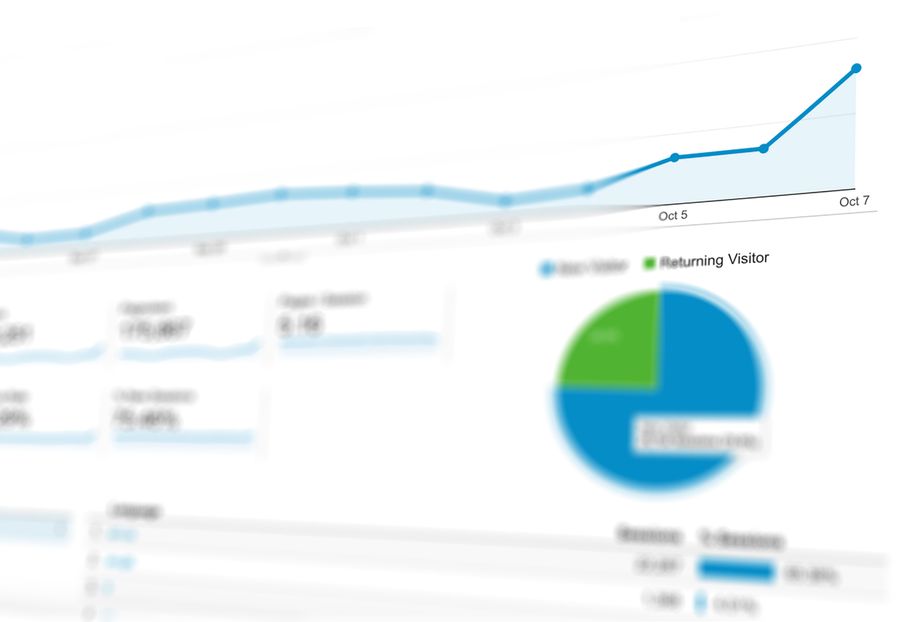
Executives and product managers do not care about TTFB. They care about:
- Is our feature fast?
- Are our users in [region] suffering?
- Are we paying for reliable APIs?
- Y-axis: Latency in milliseconds
- X-axis: Day of week
- Show TTFB as a blue line, TTFT as a purple line.
- Annotate any spikes with the region and cause (e.g., "OpenAI US-East maintenance window, 10/15").
- Rows: regions (US-East, US-West, EU-West, AP-Southeast, etc.)
- Columns: days
- Color: green (good), yellow (slow), red (very slow)
- Include a legend and exact latency ranges.
Process diagram
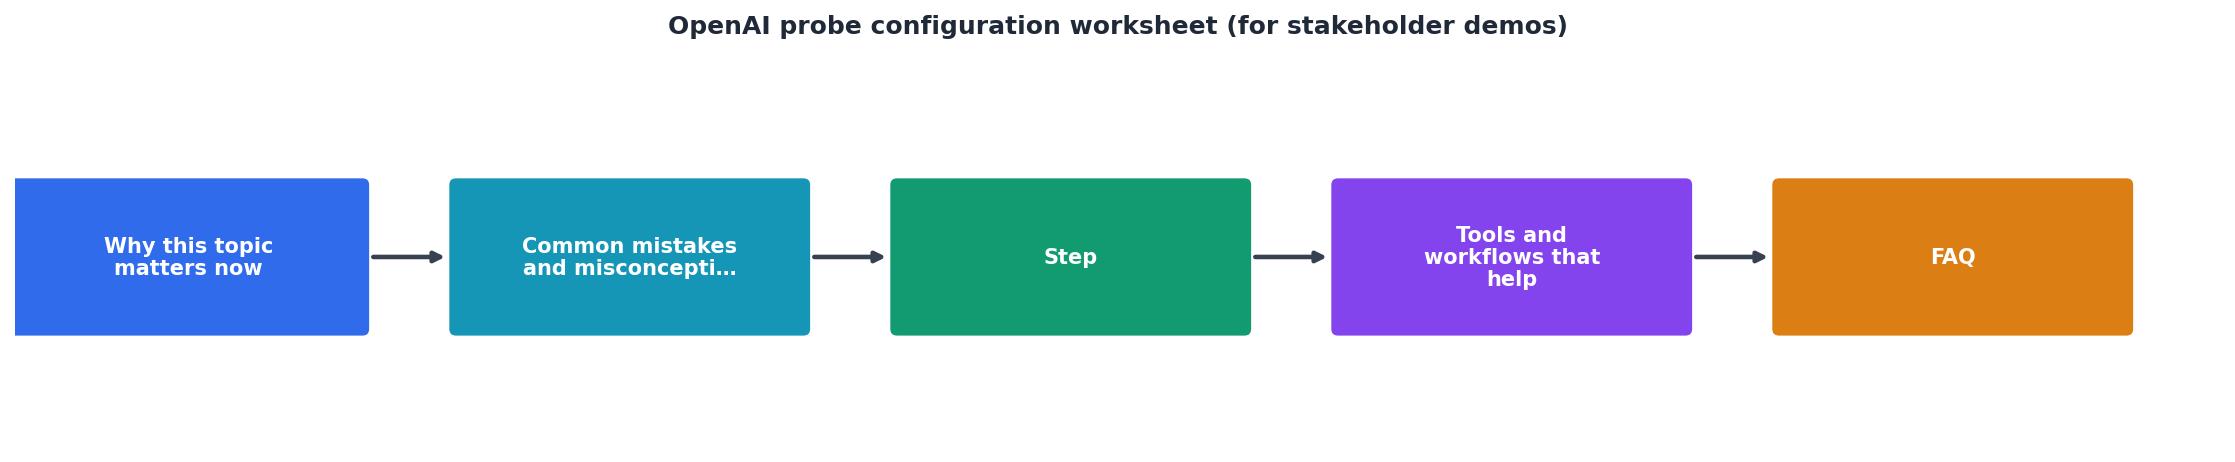
Step-by-step deployment walkthrough
Phase 1: Local testing (1 hour)
- In your development environment, craft your probe payload (see sample above).
- Test the payload with
curlor Postman against OpenAI's sandbox endpoint (if available) or a low-traffic production API key. - Verify that the response is consistent and latency is within expected range (typically 200–800 ms for gpt-3.5-turbo TTFB).
- Record the baseline latency for each model you plan to probe.
Phase 2: Configure in Observinio (30 minutes)
- Log in to Observinio dashboard.
- Click Add Probe → OpenAI API.
- Paste your endpoint URL and authentication header.
- Select 7 pilot regions (e.g., us-east-1, us-west-2, eu-west-1, eu-central-1, ap-southeast-1, ap-northeast-1, ca-central-1).
- Set probe frequency to Daily (once per 24 hours).
- Set timeout to 30 seconds.
- Save and enable the probe.
Phase 3: Validate for 5 days (ongoing)
- Check the status page daily to confirm probes are running.
- Verify latency values match your local baseline (within 10%).
- Review any errors or timeouts; if you see >2 failures, check your API key and Observinio's region connectivity.
- After 5 days of clean data, compute your SLO thresholds (1.5× baseline for TTFB, 2× baseline for TTFT).
Phase 3: Enable alerts and escalation (1 hour)
- In Observinio, navigate to Alerts → Create.
- Select your OpenAI probe.
- Set condition: "TTFB > [your threshold in ms]".
- Set action: Email (to on-call) + Slack (to #observability).
- Set severity: Warning for threshold breach, Critical for 2+ consecutive region failures.
- Enable the alert and save.
- Run a test alert to confirm email and Slack messages arrive.
Phase 4: Expand to all 21 regions (optional, week 2)
Once your pilot regions run cleanly for a week, duplicate your probe configuration and add the remaining 14 regions. Observinio automatically aggregates latency across all regions in the weekly digest email.
FAQ
Frequently Asked Questions
Getting started with Observinio alerts
Synthetic probing only works if you act on the data. Observinio's degradation alerts surface latency spikes in real time to your on-call engineer via email and Slack. Once you're confident in your baseline and SLO thresholds, alerts become your early-warning system, giving you hours or even days to adjust routing, contact OpenAI support, or switch to a backup provider before end-users are affected.
💡 Pro Tip
Start with 7 pilot regions and validate your alert thresholds for one week before expanding to all 21 regions. This reduces false positives and helps you tune SLO targets based on real production baselines rather than guesswork.
Ready to monitor your OpenAI latency across 21 regions? Visit observinio.com to set up your first probe, or contact our team for a guided walkthrough of alert configuration for your specific use case.
Additional Resources
- Model Spec (2026/08/18) - OpenAI - The Model Spec outlines the intended behavior for the models that power OpenAI's products, including the API platform. Our goal is to create models that are ...
- OpenAI GPT - Choose a GPT model to interact with#. This integration supports only the 'Chat Completions' endpoint. Therefore, you can only configure models ...
- ChatGPT Work for every team - ChatGPT Work gathers context, plans the approach, and takes action across your tools, files, and desktop apps to create polished spreadsheets, ...
Monitor AI API latency from 22 regions
Observinio runs daily probes against OpenRouter and OpenAI endpoints and emails you when latency degrades.
Set up alerts