OpenAI probe configuration worksheet (in monorepo setups)
Monorepos have become standard for teams shipping multiple services that depend on the same LLM APIs. When your chat service, recommendation engine, and content moderation stack all route through OpenAI, duplicating probe configurations across separate repositories wastes effort and creates hidden inconsistencies. A single source of truth for OpenAI latency monitoring, shared across all services in your monorepo, cuts incident response time and eliminates guesswork about whether slowness is regional, provider-wide, or local to one team's stack.

Photo by Solen Feyissa from Pexels
Monorepos have become standard for teams shipping multiple services that depend on the same LLM APIs. When your chat service, recommendation engine, and content moderation stack all route through OpenAI, duplicating probe configurations across separate repositories wastes effort and creates hidden inconsistencies. A single source of truth for OpenAI latency monitoring, shared across all services in your monorepo, cuts incident response time and eliminates guesswork about whether slowness is regional, provider-wide, or local to one team's stack.
This worksheet walks you through structuring OpenAI probe configuration as a shared package or workspace within a monorepo, so every service inherits consistent TTFB (time-to-first-byte) and TTFT (time-to-full-token) monitoring across Observinio's 21 global regions.
Key takeaway
Centralizing OpenAI probe configuration in a shared monorepo workspace eliminates latency monitoring inconsistencies, accelerates incident detection across regional endpoints, and ensures all teams follow the same SLO baselines without duplicating API credentials or configuration logic.
TL;DR
- Monorepos centralize probe configuration in a shared workspace; each service declares which regions and models to monitor.
- Define a core config schema (API key, model list, region targets, alert thresholds) once; import it everywhere.
- Use environment variable overrides to let staging and production maintain separate SLOs without duplicating the worksheet.
- Set up baseline comparisons by region to detect regional degradation within hours, not after a support ticket arrives.
- Automate the setup: generate probe manifests from your shared config, validate consistency across services, and test locally before committing.
Why Monorepos Need Shared Probe Configuration

A monorepo by design shares infrastructure, build logic, and deployment pipelines. If your chat, moderation, and analytics services all call OpenAI, each one likely has its own latency tracking code. This fragment:
- Inconsistent thresholds: Chat alerts at 800 ms TTFB; moderation uses 1200 ms. A global regional degradation shows up unevenly across dashboards.
- Duplicate API keys and configuration: Each service team manages their own OpenAI credentials, region lists, and model selections. One team upgrades gpt-4-turbo; another is still on gpt-4. Observinio probes different models depending on which service you're monitoring.
- Silent SLO drift: Without a single source of truth, nobody notices when alert thresholds creep up or regions are removed from monitoring.
- Slow incident response: During an outage, you're juggling three separate probe dashboards and trying to correlate timelines across different monitoring tools.
Structure: The Three Layers
Setting up shared OpenAI probe configuration typically involves three layers:
Layer 1: Core Configuration Schema
This is the single source of truth, a YAML or JSON file that defines:
- API keys and endpoints: OpenAI direct vs. OpenRouter (if applicable).
- Model list: Which models matter to your business (gpt-4-turbo, gpt-3.5-turbo, etc.).
- Region targets: Observinio's 21 regions you want to monitor from.
- Alert thresholds: TTFB and TTFT targets for each use case (interactive chat vs. batch processing).
- Service declarations: Which services depend on which models and regions.
monorepo/
├─ packages/
│  ├─ observability-config/
│  │  ├─ openai-probes.yaml
│  │  ├─ schema.ts (TypeScript types)
│  │  ├─ validators.ts (check consistency)
│  │  └─ generators/ (output format for Observinio)
│  ├─ chat-service/
│  │  └─ uses: observability-config
│  ├─ moderation-service/
│  │  └─ uses: observability-config
Layer 2: Declarative Service Config
Each service declares what it needs to monitor, not how to do the monitoring. This lets the shared config handle the mechanics:
# packages/chat-service/probe-declaration.yaml
service: chat-api
models:
- gpt-4-turbo
- gpt-3.5-turbo
regions:
- us-east-1
- eu-west-1
- ap-southeast-1
slo:
ttfb_ms: 500
ttft_ms: 1000
Layer 3: Generated Probe Manifest
A script consumes the core config and service declarations, then outputs probe manifests that Observinio or your internal monitoring system can ingest. This is where the translation to API calls or dashboard configs happens.
Building the Configuration Package

Step 1: Define the Schema
Start with a clear type definition. If you're using TypeScript, this doubles as documentation:
// packages/observability-config/src/schema.ts
export interface OpenAIProbeConfig {
  apiKey: string;
  baseUrl?: string;
  models: string[];
  regions: string[]; // e.g., "us-east-1", "eu-west-1"
  slo: {
    ttfbMs: number;
    ttftMs: number;
  };
  alertEmail?: string;
  tags?: Record<string, string>;
}

export interface ServiceProbeDeclaration {
  service: string;
  models: string[];
  regions: string[];
  slo: { ttfbMs: number; ttftMs: number };
  environment?: 'staging' | 'production';
}
Step 2: Create the Core Config File
Store your baseline configuration in the shared package:
# packages/observability-config/config/openai-probes.yaml
metadata:
version: 1
lastUpdated: 2026-09-01
owner: platform-team
contact: platform@company.com
apiConfig:
apiKey: ${OPENAI_API_KEY} # loaded from environment
baseUrl: https://api.openai.com/v1
globalModels:
- gpt-4-turbo
- gpt-4
- gpt-3.5-turbo
monitoredRegions:
- us-east-1
- us-west-2
- eu-west-1
- eu-central-1
- ap-southeast-1
- ap-northeast-1
defaultSLO:
production:
ttfbMs: 500
ttftMs: 1000
staging:
ttfbMs: 800
ttftMs: 1500
services:
chat-api:
models: [gpt-4-turbo, gpt-3.5-turbo]
regions: [us-east-1, eu-west-1, ap-southeast-1]
alertEmail: chat-oncall@company.com
moderation-service:
models: [gpt-3.5-turbo]
regions: [us-east-1, us-west-2, eu-west-1]
alertEmail: moderation-oncall@company.com
analytics-service:
models: [gpt-4]
regions: [us-east-1]
alertEmail: analytics-team@company.com
Step 3: Write Validators
Catch configuration errors before probes run:
// packages/observability-config/src/validators.ts
import Ajv from 'ajv';
import  as fs from 'fs';
import  as yaml from 'js-yaml';

export function validateProbeConfig(configPath: string): boolean {
  const rawConfig = fs.readFileSync(configPath, 'utf-8');
  const config = yaml.load(rawConfig);

const ajv = new Ajv();
  const schema = {
    type: 'object',
    required: ['apiConfig', 'globalModels', 'monitoredRegions', 'services'],
    properties: {
      apiConfig: { type: 'object' },
      globalModels: { type: 'array', items: { type: 'string' } },
      monitoredRegions: { type: 'array', items: { type: 'string' } },
      services: { type: 'object' },
    },
  };

const valid = ajv.validate(schema, config);
  if (!valid) {
    console.error('Config validation failed:', ajv.errors);
    return false;
  }
  console.log('✓ Config is valid');
  return true;
}
Step 4: Build a Generator
Convert your YAML config into probe manifests that Observinio can consume:
// packages/observability-config/src/generate-observinio-manifest.ts
import  as yaml from 'js-yaml';
import  as fs from 'fs';

export function generateObservinioManifest(configPath: string, outputPath: string) {
  const rawConfig = fs.readFileSync(configPath, 'utf-8');
  const config = yaml.load(rawConfig) as any;

const probes: any[] = [];

for (const [serviceName, serviceConfig] of Object.entries(config.services)) {
    const { models, regions, alertEmail } = serviceConfig as any;

for (const model of models) {
      for (const region of regions) {
        probes.push({
          id: ${serviceName}-${model}-${region},
          service: serviceName,
          model,
          region,
          endpoint: ${config.apiConfig.baseUrl}/chat/completions,
          frequency: 'hourly',
          timeout: 10000,
          alertThreshold: {
            ttfbMs: config.defaultSLO.production.ttfbMs,
            ttftMs: config.defaultSLO.production.ttftMs,
          },
          alertEmail,
          tags: {
            service: serviceName,
            environment: 'production',
          },
        });
      }
    }
  }

fs.writeFileSync(outputPath, JSON.stringify({ probes }, null, 2));
  console.log(✓ Generated ${probes.length} probe definitions to ${outputPath});
}
Setting Up Environment Overrides
Production and staging typically have different SLOs. Instead of maintaining separate YAML files, use environment variables:
# .env.production
OPENAI_API_KEY=sk-prod-xxx
PROBE_ENVIRONMENT=production
PROBE_TTFB_THRESHOLD_MS=500
PROBE_TTFT_THRESHOLD_MS=1000

OPENAI_API_KEY=sk-staging-xxx
PROBE_ENVIRONMENT=staging
PROBE_TTFB_THRESHOLD_MS=800
PROBE_TTFT_THRESHOLD_MS=1500
Then load these in your generator:
function loadConfigWithEnvironmentOverrides(configPath: string): OpenAIProbeConfig {
  const baseConfig = yaml.load(fs.readFileSync(configPath, 'utf-8')) as any;

  const environment = process.env.PROBE_ENVIRONMENT || 'production';
  const ttfbMs = parseInt(process.env.PROBE_TTFB_THRESHOLD_MS || '500', 10);
  const ttftMs = parseInt(process.env.PROBE_TTFT_THRESHOLD_MS || '1000', 10);

return {
    ...baseConfig,
    defaultSLO: {
      ...baseConfig.defaultSLO,
      [environment]: { ttfbMs, ttftMs },
    },
  };
}
Regional Baseline Comparison
One of Observinio's key strengths is comparing current latency against a rolling baseline. In your config, declare which regions you want to compare:
# packages/observability-config/config/openai-probes.yaml
baselineComparison:
enabled: true
windowDays: 7 # compare this week to last week
alertOnDegradation:
ttfbIncrease: 150 # ms
ttftIncrease: 300 # ms
regions:
- us-east-1
- eu-west-1
- ap-southeast-1
This way, if us-east-1 TTFB jumps from 350 ms to 510 ms, your team gets alerted within the hour, before customers notice slowness.
Automation: Validation and Testing
"Author's note (March 2026): Since this post was written, this monorepo has migrated from Yarn to pnpm.">, Sharing Configurations Within a Monorepo
Add a pre-commit hook and CI check to catch configuration drift early:
#!/bin/bash

set -e

echo "Validating OpenAI probe configuration..."
npx ts-node packages/observability-config/src/validators.ts

echo "Generating Observinio manifest..."
npx ts-node packages/observability-config/src/generate-observinio-manifest.ts \
  packages/observability-config/config/openai-probes.yaml \
  dist/probes.json

echo "Running local probe test (dry-run)..."
npx ts-node packages/observability-config/src/test-probes-locally.ts dist/probes.json

echo "✓ All checks passed"
Wire this into your CI pipeline (GitHub Actions, GitLab CI, etc.):
# .github/workflows/validate-probes.yml
name: Validate OpenAI Probes
on: [pull_request, push]
jobs:
validate:
runs-on: ubuntu-latest
steps:
- uses: actions/checkout@v3
- uses: actions/setup-node@v3
with:
node-version: 18
- run: npm install
- run: bash scripts/validate-probe-config.sh
Your progress is saved automatically in your browser.
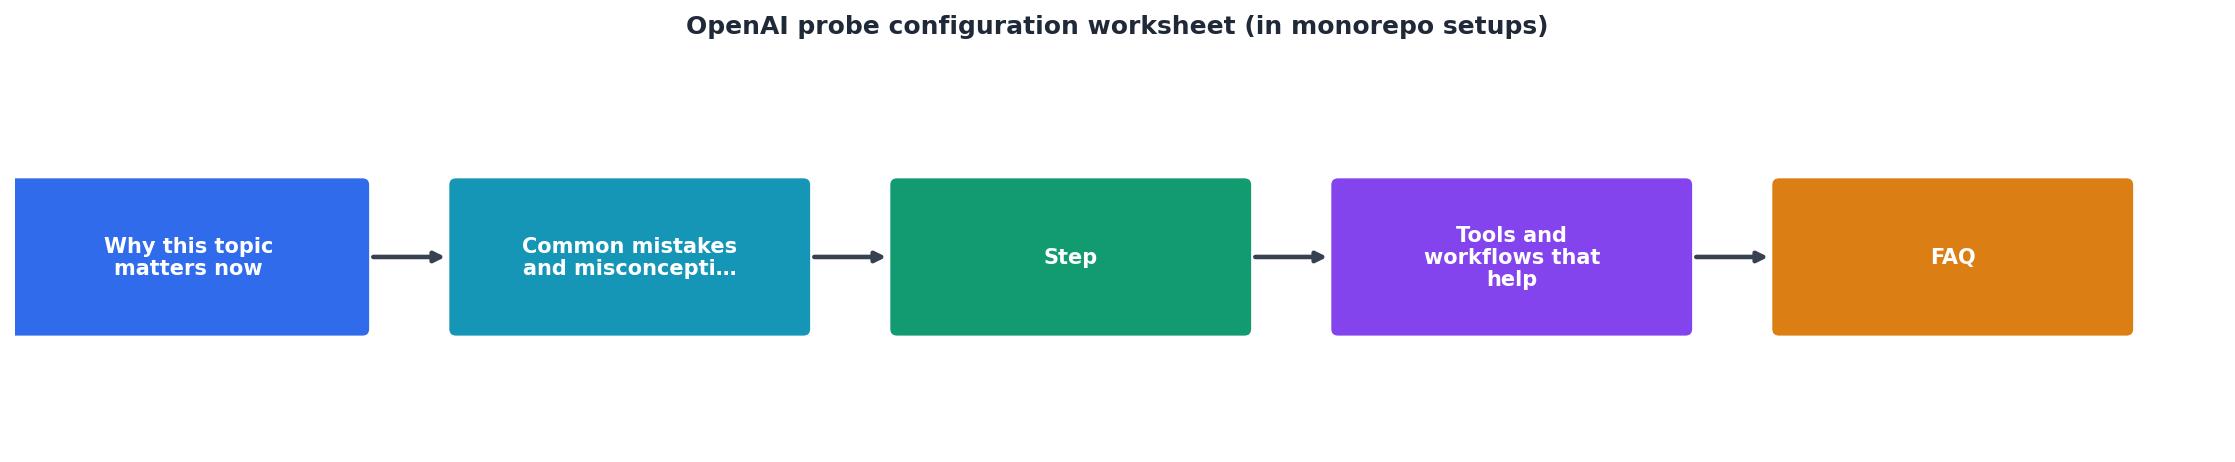
Process Diagram
Common Pitfalls and How to Avoid Them
Pitfall 1: API Key sprawl.
Each service team checks in their own OpenAI key. One team rolls a key; probes across three services break silently.
Solution: Store API keys in a secret manager (HashiCorp Vault, AWS Secrets Manager, or GitHub Secrets). Load them at probe runtime, never commit them.
Pitfall 2: Regional coverage gaps.
The chat service monitors five regions; moderation monitors only two. A regional outage affects moderation but goes undetected.
Solution: Enforce a minimum region list in validators. If a service wants to opt out of a region, make it explicit and logged.
Pitfall 3: Threshold creep.
Over time, teams raise TTFB thresholds to reduce noise. Suddenly, 1200 ms latency is "acceptable" when it used to trigger alerts.
Solution: Version the config file and review threshold changes in code review. Keep a changelog of SLO updates.
Pitfall 4: Forgetting to test the manifest locally.
You push a config change; Observinio rejects it because a region name is misspelled. Probes go dark for an hour.
Solution: Always run test-probes-locally.ts before committing. Make it part of the pre-commit hook.
FAQ
Frequently Asked Questions
.env.local file (add it to .gitignore), and rotate keys quarterly.service or team field in your config declarations. Use that field to scope which teams get alerted and which regions they monitor. The core schema stays shared, but each service can declare its own SLOs and region preferences. Use validators to ensure no team accidentally monitors outside their approved regions.apiProvider field to your schema and config, either "openai" or "openrouter", and adjust the endpoint URL accordingly. Your generator can branch based on this field and create probe manifests for either provider (or both). Observinio supports monitoring both, so you can compare latency across providers from the same configuration./status page to check for known incidents. If failures persist, page the on-call engineer and disable the probe temporarily via the config while investigating.🚀 Ready to Deploy Shared Probes?
Start with a single YAML file, validate with TypeScript, generate manifests for all 21 regions, and integrate environment-specific SLOs in under 15 minutes using the patterns from this guide.
Wrapping Up: Operationalizing Shared Probe Configuration
A monorepo with a unified OpenAI probe configuration turns latency monitoring from a firefighting exercise into a predictable ops discipline. By versioning, validating, and automating your probe setup, you catch regional degradation hours before customers complain, and you respond to incidents with confidence because all teams are looking at the same SLOs and baselines.
Start with the schema and core config file. Add validators and generators incrementally. Once your probes are live in Observinio's 21 regions and alerts are flowing to your on-call channels, the payoff comes quickly: faster incident response, data-driven provider decisions, and the peace of mind that latency isn't a surprise.
For detailed setup guides and to configure your first OpenAI probes across all 21 regions, visit Observinio's status page to see real-time latency from your geography, or explore provider comparison if you're evaluating OpenRouter alongside direct OpenAI endpoints. Questions about regional degradation or alert thresholds? Contact our team for a quick consultation on SLO baselines that fit your use case. By implementing these practices, teams reduce mean time to incident detection and ensure consistent monitoring coverage across all business-critical OpenAI integrations.
Additional Resources
- Use an Open AI calls in a monorepo #6075 - Use an Open AI calls in a monorepo. These project use the same approach to make calls in OpenAI. make a configuration of this type and that it works in a ...
- Sharing Configurations Within a Monorepo - How do we go about it? Well, the first thing I did was to create a base configuration file under the root of the monorepo, called jest.config.
- Monorepo setup guide How Big Companies Share Code ... - Monorepo setup guide How Big Companies Share Code Across Projects.
Monitor AI API latency from 22 regions
Observinio runs daily probes against OpenRouter and OpenAI endpoints and emails you when latency degrades.
Set up alerts