OpenAI probe configuration worksheet (with SSR enabled)
Server-Side Rendering adds a latency-critical path between your backend and the OpenAI API that most monitoring setups completely ignore. When your Next.js, Nuxt, or SvelteKit server fetches a chat completion during the render cycle, every millisecond of TTFB from OpenAI translates directly into a slower page load for the end user. This worksheet walks you through configuring synthetic probes that mirror that SSR call pattern, so you catch degradation before your visitors do.

Photo by MART PRODUCTION from Pexels
Server-Side Rendering adds a latency-critical path between your backend and the OpenAI API that most monitoring setups completely ignore. When your Next.js, Nuxt, or SvelteKit server fetches a chat completion during the render cycle, every millisecond of TTFB from OpenAI translates directly into a slower page load for the end user. This worksheet walks you through configuring synthetic probes that mirror that SSR call pattern, so you catch degradation before your visitors do.
TL;DR
- SSR-enabled apps make OpenAI calls on the server render path, meaning API latency directly inflates page TTFB.
- Probes must replicate the exact model, token budget, and region your SSR servers use, generic health checks are not enough.
- Observinio's 21-region daily probes let you set per-region baselines and receive email alerts when latency drifts beyond your threshold.
- This worksheet provides a step-by-step checklist, a sample probe payload, and a validation procedure you can run today.
- Pair probes with weekly summary emails to spot slow-burn regressions that single-day alerts miss.
Why SSR changes the monitoring equation

In a client-side architecture, a slow OpenAI response degrades one component of an already-rendered page. The user sees a spinner, but the shell is interactive. With SSR the situation is fundamentally different: the HTML itself is blocked until the completion returns. That means a P95 TTFT spike from 400 ms to 1 200 ms can push your Largest Contentful Paint well beyond the 2.5-second threshold Google considers "good."
Key differences between client-side and SSR latency impact
| Factor | Client-side call | SSR call |
|---|---|---|
| Blocking resource | Component only | Entire HTML response |
| User perception | Spinner in widget | Blank page / slow navigation |
| Retry opportunity | Can retry in browser | Must retry on server before timeout |
| Cache layer | Browser / CDN edge | Server memory or Redis |
| Monitoring blind spot | Visible in RUM | Hidden behind aggregate TTFB |
⚡ SSR latency impact at a glance
Client-side call: Only the widget is blocked — the page shell remains interactive and the user sees a loading spinner.
SSR call: The entire HTML response is blocked — the browser shows a blank page until the OpenAI completion returns, directly inflating TTFB and LCP.
Prerequisites before you start
Before filling in the worksheet, gather the following information from your codebase and infrastructure:
- Model identifier, the exact
modelstring your SSR route passes to the OpenAI API (e.g.,gpt-4o,gpt-4o-mini). - Max tokens budget, the
max_tokensormax_completion_tokensvalue your server sets. Probes should match this to get realistic timing. - System prompt length, measure the token count of your system prompt. A 600-token system prompt adds measurable prefill time compared to a 50-token one.
- Server regions, list every region where your SSR servers run (e.g.,
us-east-1,eu-west-1,ap-southeast-1). - Timeout value, the hard timeout your HTTP client enforces. Probes that exceed this value represent a functional failure, not just slow performance.
- Authentication method, confirm whether you call OpenAI directly or route through OpenRouter, as the probe endpoint differs.
Step-by-step probe configuration worksheet
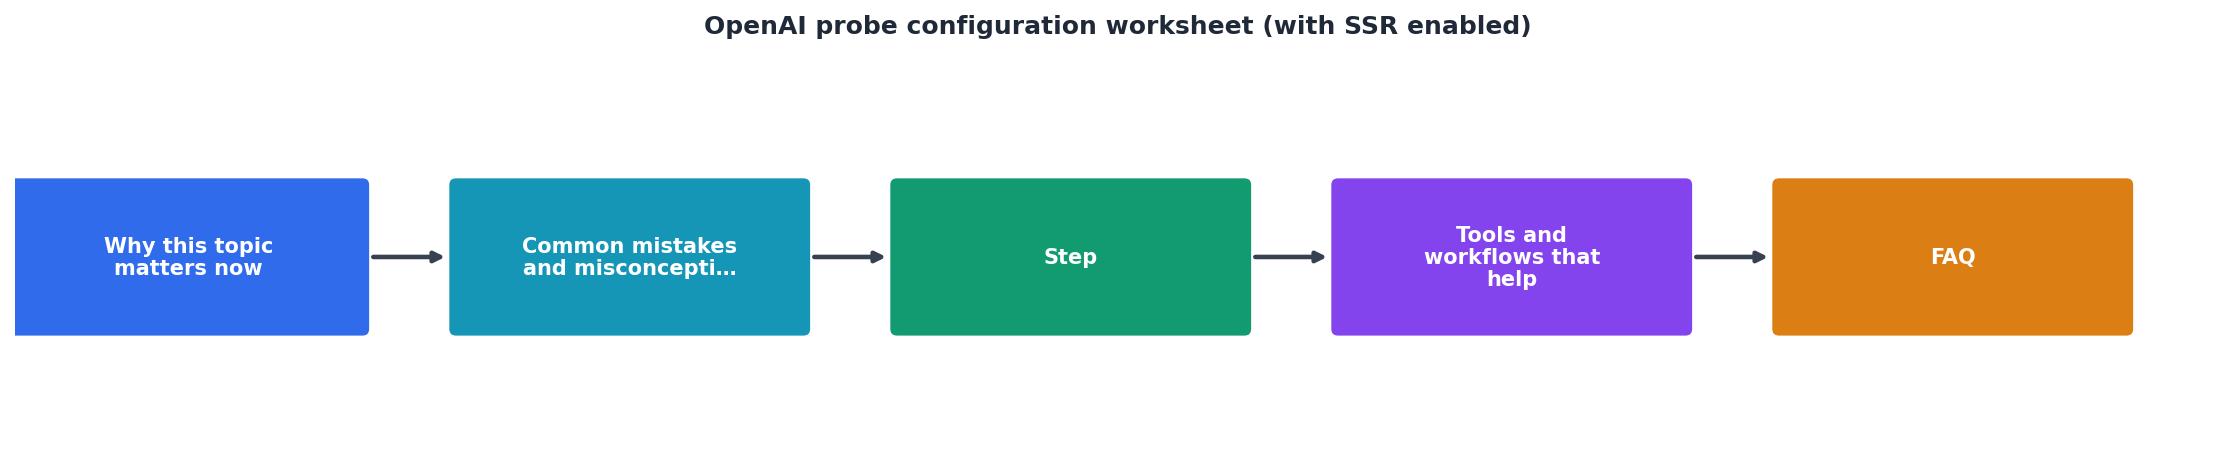
Follow these steps in order. Each step produces a concrete output you will need for the next one.
Step 1, Document your SSR call signature
Open the server route that calls OpenAI and extract the request shape. Record it in a table like this:
| Parameter | Your value |
|---|---|
| Endpoint | https://api.openai.com/v1/chat/completions |
| Model | ______ |
max_tokens | ______ |
temperature | ______ |
| System prompt tokens | ______ |
| Stream | true / false |
| Timeout (ms) | ______ |
stream is true, your primary latency metric is TTFT (Time to First Token). If false, measure total response time.
Step 2, Define your baseline window
Choose a 7-day period of normal traffic to establish baselines. Avoid weeks with known incidents or model updates. Record the P50 and P95 latency for each region your servers occupy. If you do not have historical data, Observinio's first week of probe results will generate these baselines automatically.
Step 3, Build the probe payload
Your probe payload should mirror the SSR call as closely as possible. Here is a sample configuration:
{
  "model": "gpt-4o",
  "messages": [
    {
      "role": "system",
      "content": "You are a concise assistant for a product page. Answer in two sentences maximum."
    },
    {
      "role": "user",
      "content": "Summarize the key benefit of this product."
    }
  ],
  "max_tokens": 100,
  "temperature": 0.3,
  "stream": false
}
Keep the prompt deterministic and short enough that token generation time does not dominate the measurement. The goal is to isolate network and prefill latency, which is what SSR users actually wait for.
Step 4, Select probe regions
Map your SSR server regions to the closest Observinio probe regions. Observinio runs probes from 21 global locations, so you can typically find a one-to-one match or a region within the same continent. At minimum, configure probes for:
- Every region where you deploy SSR servers.
- At least one region on a different continent, to detect global vs. regional incidents.
- The region where the majority of your end users are located, even if you do not have servers there (this validates CDN or edge-function latency).
Step 5, Set alert thresholds
Use your baseline P95 as the starting point. A practical formula:
- Warning threshold = baseline P95 × 1.3
- Critical threshold = baseline P95 × 2.0 or your server timeout, whichever is lower.
us-east-1 P95 is 450 ms and your server timeout is 3 000 ms, set warning at 585 ms and critical at 900 ms. Configure Observinio email alerts for both levels so you can triage before users are affected.
Step 6, Validate the probe end-to-end

After saving your probe configuration, verify it produces data:
- Wait for the next scheduled probe cycle (daily probes run once every 24 hours).
- Check the Observinio status page for your provider and confirm the new probe appears.
- Compare the first probe result against your recorded baseline. If the value is more than 2× your expected P50, double-check the model name and endpoint, a typo can route to a different model with different performance characteristics.
- Trigger a test alert by temporarily lowering the warning threshold below the last measured value. Confirm the email arrives, then restore the real threshold.
SSR-specific tuning tips
Once probes are running, use the data to tune your SSR pipeline:
- Add a server-side cache, If the same prompt produces the same output (e.g., product descriptions), cache completions in Redis with a TTL matching your content freshness requirements. Probes will still measure the uncached path, giving you a worst-case baseline.
- Implement a streaming fallback, If your framework supports it, switch to streaming so the server can flush partial HTML while tokens arrive. Monitor TTFT instead of total response time in this case.
- Set aggressive timeouts with graceful degradation, If the probe shows P95 above 1 500 ms in a region, consider serving a cached or static fallback for that region rather than blocking the render.
- Compare direct vs. OpenRouter, Run parallel probes against both
api.openai.comand the equivalent OpenRouter endpoint. Observinio tracks both providers, so you can view the comparison on the OpenRouter provider page alongside your direct OpenAI data.
Key takeaway: SSR makes every millisecond of OpenAI API latency visible to the end user as slower page loads. Synthetic probes configured to match your exact SSR call signature — same model, token budget, and region — are the only reliable way to detect degradation before it impacts Core Web Vitals.
"Similarly, several of our indirect prompt injection benchmarks that target attacks in developer tools and browsing have been saturated by our latest model (>97% accuracy).">, GPT
This level of model maturity means the performance envelope is increasingly stable, but infrastructure latency remains variable. Probes catch what model benchmarks do not.
Ongoing maintenance checklist
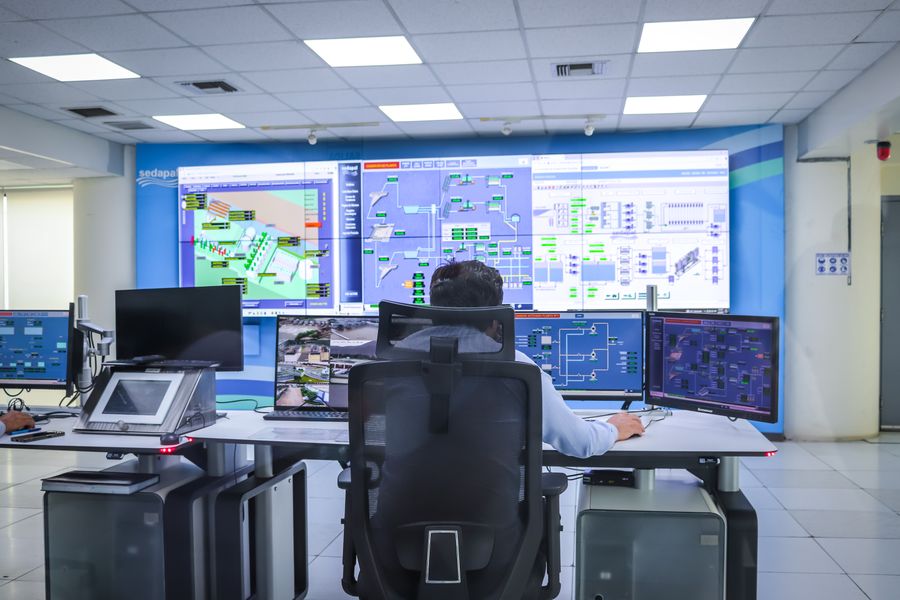
Probes are not set-and-forget. Use this checklist on a monthly cadence:
Your progress is saved automatically in your browser.
Interpreting your first week of data
After seven days of probe results, you have enough data to make decisions:
- Flat line across regions, OpenAI latency is consistent; your SSR latency issues are likely in your own stack (database queries, template rendering).
- One region significantly slower, Possible routing issue on OpenAI's side or network path degradation. Check if the region is geographically distant from OpenAI's inferred server locations.
- Spikes at the same time each day, Correlates with peak usage windows. Consider pre-warming caches or shifting SSR to edge functions in those regions.
- Gradual upward trend, May indicate a model update or increased load on OpenAI's infrastructure. Use this data to justify a provider switch or multi-provider failover strategy.
Frequently Asked Questions
model field in your probe configuration to match your production code. Then mark the date in your tracking so you can attribute any baseline shift to the model change rather than an infrastructure issue. Observinio's weekly summaries make it easy to spot the inflection point.If you are running SSR workloads that depend on OpenAI completions, latency monitoring is not optional, it is part of your render pipeline. Observinio's daily probes across 21 regions, combined with baseline comparison and email degradation alerts, give you the visibility SSR demands without building a custom synthetic testing stack. Visit the status page to see current provider latency or get in touch to configure probes tailored to your SSR architecture.
Additional Resources
- GPT-Red: Unlocking Self-Improvement for Robustness - Explore GPT-Red, OpenAI's automated red teaming system that uses self-play to improve AI safety, alignment, and prompt injection robustness.
- OpenAI - Configure OpenAI models including GPT-5.6, GPT-5.5, GPT-4.1, o-series reasoning, embeddings, and assistants for comprehensive AI evals.
- Configuring Open AI Compatible Endpoint - I am attempting to configure an OpenAI compatible endpoint but I am unable to enter the model name manually.
Monitor AI API latency from 22 regions
Observinio runs daily probes against OpenRouter and OpenAI endpoints and emails you when latency degrades.
Set up alerts