OpenAI probe configuration worksheet (for design ops)
Design ops teams increasingly depend on OpenAI-powered features, from AI-assisted copy generation to automated asset tagging, and every one of those features is only as reliable as the API call behind it. When a probe is misconfigured, the result is not just a failed request; it is a broken design pipeline, a missed deadline, and a frustrated team that blames "the AI" instead of the network path. This worksheet walks you through every decision you need to make before your first synthetic probe fires, so latency issues surface in your monitoring dashboard instead of in a Slack thread at 11 PM.

Photo by Paul Seling from Pexels
Design ops teams increasingly depend on OpenAI-powered features, from AI-assisted copy generation to automated asset tagging, and every one of those features is only as reliable as the API call behind it. When a probe is misconfigured, the result is not just a failed request; it is a broken design pipeline, a missed deadline, and a frustrated team that blames "the AI" instead of the network path. This worksheet walks you through every decision you need to make before your first synthetic probe fires, so latency issues surface in your monitoring dashboard instead of in a Slack thread at 11 PM.
TL;DR
- A well-configured OpenAI probe needs five explicit choices: endpoint, model, region set, schedule cadence, and alert threshold.
- Design ops workflows are latency-sensitive because they often run synchronously inside tools like Figma plugins or CI pipelines that block on API responses.
- Choosing the wrong region set or probe interval hides the exact variance that causes intermittent slowdowns.
- This worksheet gives you a fill-in checklist, a step-by-step configuration walkthrough, and threshold formulas you can adapt to your SLOs.
- Observinio's 21-region probe infrastructure removes the need to self-host synthetic checks while giving you per-region TTFB and TTFT data.
Why design ops needs dedicated OpenAI probes
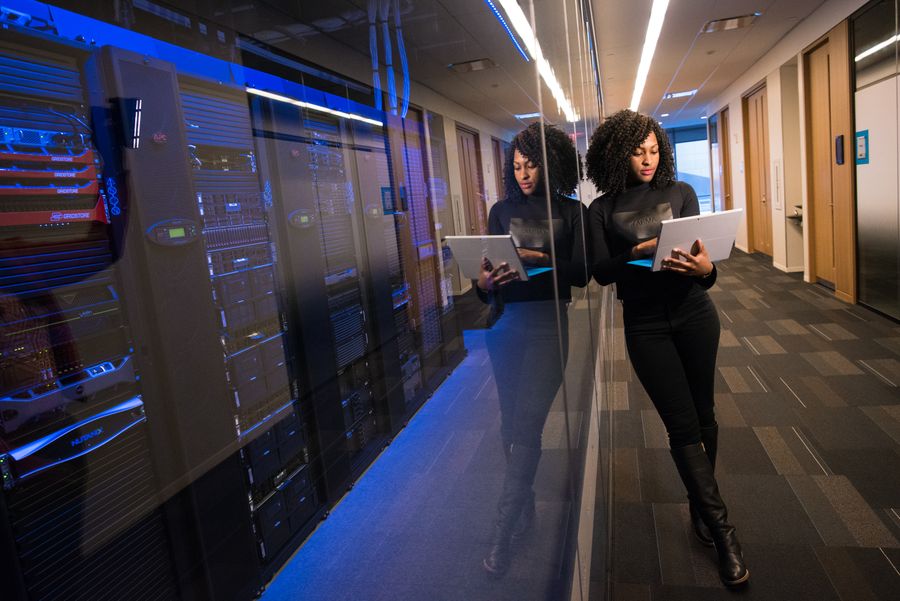
Design operations sits at the intersection of creative tooling and engineering infrastructure. When a design system team ships a Figma plugin that calls gpt-4o to generate alt-text for component thumbnails, the call travels from the designer's browser, through a backend proxy, to the OpenAI endpoint, and back. Each hop adds latency, and the OpenAI segment is the one you control the least.
Without a synthetic probe running against the same endpoint and model your plugin uses, you have zero visibility into whether a slowdown originates from OpenAI's infrastructure, your proxy layer, or regional network conditions. Traditional APM tools capture the round-trip from your server, but they do not isolate the provider segment or compare it across geographies.
Design ops probes differ from generic API health checks in three ways:
- Model specificity matters. A probe hitting
gpt-3.5-turbotells you nothing aboutgpt-4olatency. Different models route to different inference clusters on OpenAI's side, and their performance profiles diverge significantly under load. - Payload shape should mirror real usage. If your design tool sends 200-token prompts and expects 50-token completions, your probe should replicate that shape. A probe with a 2,000-token prompt will measure a different queue and processing path.
- Region selection must match your designer population. If your design team is split between Berlin and San Francisco, probing only from
us-east-1misses the European latency story entirely.
The probe configuration worksheet
Below is the complete worksheet. Copy it, fill in each field, and use the result as the source of truth for your probe setup, whether you configure probes manually or through Observinio's dashboard.
Section A: Endpoint & authentication
| Field | Your value | Notes |
|---|---|---|
| Base URL | https://api.openai.com/v1 | Use the direct OpenAI endpoint unless you route through OpenRouter |
| API path | /chat/completions | Match the exact path your production code calls |
| Auth header | Authorization: Bearer sk-… | Use a dedicated monitoring API key with minimal permissions |
| Organization ID | org-… | Required if your key belongs to multiple orgs |
| Timeout (ms) | ______ | Recommended: 2× your p95 production latency |
Section B: Model & payload
| Field | Your value | Notes |
|---|---|---|
| Model ID | e.g. gpt-4o | Must match the model your design tool calls |
| System prompt | ______ | Keep it short; mirror your production system prompt length |
| User prompt | ______ | Use a deterministic test prompt (same tokens every run) |
| Max tokens | ______ | Match your production max_tokens parameter |
| Temperature | 0 | Deterministic output reduces noise in response-size variance |
| Stream | true / false | If your tool streams, probe with streaming to capture TTFT accurately |
Section C: Region set
Select every region where your designers or end-users are located. Observinio supports 21 regions; the most relevant for design ops teams are typically:
- us-east-1, East Coast US / default for many SaaS tools
- us-west-2, West Coast US
- eu-west-1, Ireland / Western Europe
- eu-central-1, Frankfurt / Central Europe
- ap-northeast-1, Tokyo / APAC design studios
- ap-southeast-1, Singapore
Section D: Schedule & alerting
| Field | Your value | Notes |
|---|---|---|
| Probe interval | ______ min | Daily probes catch trends; 15-min probes catch incidents |
| Baseline window | ______ days | 7-day rolling baseline is a solid default |
| Alert threshold (TTFB) | ______ ms | Formula: baseline p50 × 1.5 for warning, × 2.5 for critical |
| Alert threshold (TTFT) | ______ ms | Relevant only if streaming is enabled |
| Alert channel | email / Slack / PagerDuty | Observinio sends email alerts; integrate with your ops channel |
| Weekly summary | yes / no | Enables trend tracking without manual dashboard checks |
Step-by-step: configuring your first probe
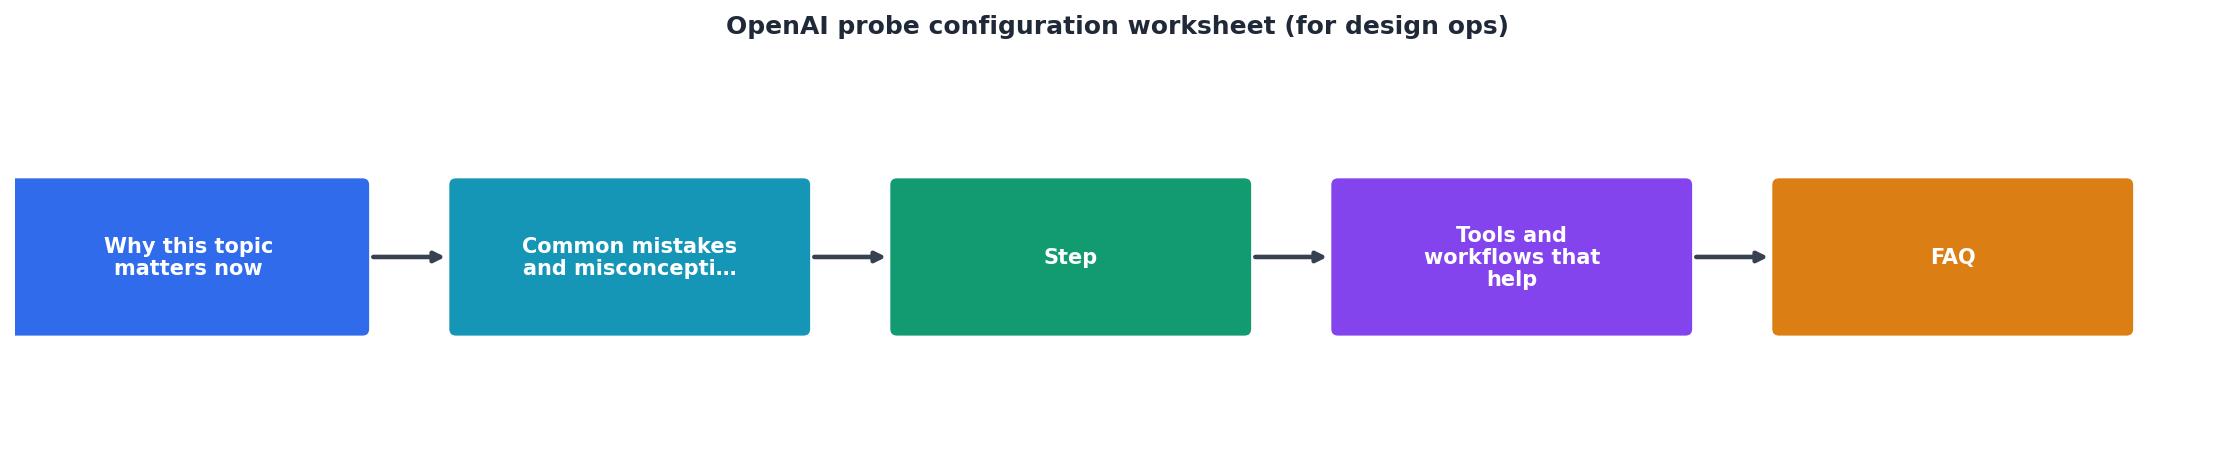
Follow these steps once you have filled in the worksheet above.
- Create a dedicated API key. Log into the OpenAI dashboard, generate a new key, and label it
observinio-probe-designops. Restrict it to the specific project or organization your design tools use. This isolates probe traffic from production billing and makes key rotation painless.
- Define the probe payload. Write a JSON body that mirrors your production call. For example, if your Figma plugin sends a short prompt to generate alt-text, your probe payload might look like this:
   {
     "model": "gpt-4o",
     "messages": [
       {"role": "system", "content": "You generate concise alt-text for UI components."},
       {"role": "user", "content": "Describe a primary action button with a shopping cart icon."}
     ],
     "max_tokens": 40,
     "temperature": 0,
     "stream": true
   }
- Select regions from Section C. In Observinio, navigate to the probe configuration screen and check each region you marked in the worksheet. If your team is primarily in Europe and the US, start with at least
us-east-1,us-west-2,eu-west-1, andeu-central-1. Adding more regions later is trivial, but removing noisy regions after alert fatigue sets in is harder, so start intentionally.
- Set the schedule. For design ops, a probe every 60 minutes during business hours (08:00–20:00 local time per region) is a practical starting point. If your design tools run CI jobs overnight (e.g., automated screenshot generation), extend coverage to 24 hours.
- Configure alert thresholds. Use the baseline comparison approach: let the probe run for seven days without alerts to establish a baseline, then set warning at 1.5× the p50 TTFB and critical at 2.5× the p50 TTFB. For streaming probes, add a separate TTFT threshold, typically warning at 800 ms and critical at 1,500 ms for
gpt-4o, though your baseline data will refine these numbers.
- Enable the weekly summary email. This is the artifact your design ops lead will actually read. It shows week-over-week latency trends per region and flags any models whose performance shifted. Share it in your design ops Slack channel every Monday.
- Validate the probe. Trigger a manual run and confirm that the response status is 200, the latency values appear in the dashboard, and the payload shape matches expectations. Check at least two regions to verify there is no authentication or routing issue specific to a geography.
Your progress is saved automatically in your browser.
Interpreting probe results for design ops decisions
Once your probes are running, the data feeds three categories of design ops decisions:
Tool reliability commitments
If your design system team promises plugin users that "AI alt-text generates in under two seconds," you need probe data to back that claim. Pull the p95 TTFB from your primary regions and add your proxy overhead. If the sum exceeds two seconds in any region where you have designers, either adjust the promise or add a loading state to the plugin UX.
Provider and model selection
Probe data across regions makes model migration decisions evidence-based. When OpenAI releases a new model version, spin up a parallel probe with the new model ID and compare TTFB and TTFT side by side for two weeks. If the new model is consistently 30% slower in eu-central-1, your European designers will notice, and you will have the data to delay migration for that region until performance stabilizes.
Incident response
When a designer reports "the AI is slow," the first question is whether the issue is global, regional, or local. A quick glance at the Observinio status page or the probe dashboard answers that in seconds. If probes from eu-west-1 show elevated TTFB but us-east-1 is normal, you know the problem is regional and can advise European designers to expect delays while you investigate further.
Key takeaway: Probe data transforms design ops from reactive firefighting into proactive infrastructure management. By matching probe configuration to your actual production payload, regions, and streaming mode, you gain per-region latency visibility that lets you make evidence-based decisions about tool reliability, model migration, and incident triage.
Alert threshold calculator
Enter your baseline p50 TTFB (in ms) from the seven-day baseline window to get recommended warning and critical thresholds.
Warning: 480 ms | Critical: 800 ms
Common configuration mistakes to avoid

Even experienced platform engineers make these errors when setting up probes for the first time:
- Using a generic prompt that does not match production token counts. A one-word prompt and a 200-word prompt exercise different parts of the inference pipeline. Match your production payload shape as closely as possible.
- Probing only one region. If you probe from a single US region and your design team spans three continents, you are monitoring a fraction of the actual user experience. Observinio's 21-region coverage exists precisely for this reason.
- Setting thresholds before establishing a baseline. Arbitrary thresholds (e.g., "alert if TTFB > 500 ms") cause either alert fatigue or missed incidents. Run probes for at least one week to collect baseline data, then derive thresholds from actual percentiles.
- Forgetting to update probes after model changes. When your design tool switches from
gpt-4otogpt-4o-mini, the old probe keeps reporting data for a model you no longer use. Add a calendar reminder to audit probe configurations monthly. - Ignoring streaming vs. non-streaming mismatch. If your production code streams responses but your probe does not, you are measuring a fundamentally different latency profile. TTFT (time to first token) only applies to streaming requests, and it is often the metric that matters most for perceived speed in interactive design tools.
Frequently Asked Questions
api.openai.com) and OpenRouter (openrouter.ai/api) have different authentication schemes, routing logic, and latency profiles. Configure separate probes for each provider. This also lets you compare them side by side, Observinio's OpenRouter provider page shows how latency differs from direct OpenAI calls across regions, which is valuable data when deciding whether to route design tool traffic through OpenRouter for cost savings or stick with direct access for lower latency.Start monitoring before the next incident
Filling in this worksheet takes about 20 minutes. Configuring the actual probes in Observinio takes less than five. The payoff is continuous, per-region visibility into the OpenAI endpoints your design tools depend on, plus email alerts when latency degrades and weekly summaries that keep your design ops lead informed without requiring dashboard access. Visit the Observinio status page to see live probe data, or get in touch to set up probes tailored to your design ops stack.
Monitor AI API latency from 22 regions
Observinio runs daily probes against OpenRouter and OpenAI endpoints and emails you when latency degrades.
Set up alerts