OpenAI probe configuration worksheet (for solo developers)
When you are the only engineer on the project, every minute spent debugging a mystery slowdown is a minute stolen from shipping features. OpenAI's API can behave very differently depending on the model, the region your server sits in, and the time of day, yet most solo developers never set up a single synthetic probe until after a user complains. This worksheet walks you through configuring OpenAI latency probes from scratch, so you catch degradation before your customers do.

Photo by Paul Seling from Pexels
When you are the only engineer on the project, every minute spent debugging a mystery slowdown is a minute stolen from shipping features. OpenAI's API can behave very differently depending on the model, the region your server sits in, and the time of day, yet most solo developers never set up a single synthetic probe until after a user complains. This worksheet walks you through configuring OpenAI latency probes from scratch, so you catch degradation before your customers do.
TL;DR
- Solo developers need lightweight, automated probes, not a full observability stack, to monitor OpenAI API latency.
- Start with one model and two regions, then expand once you have a week of baseline data.
- Track TTFB (Time to First Byte) and TTFT (Time to First Token) separately; they reveal different failure modes.
- Set alert thresholds at 1.5× your measured baseline, not at arbitrary round numbers.
- Observinio's daily probes across 21 regions can replace a custom cron-plus-dashboard setup in under five minutes.
Why solo developers skip probe configuration (and why that hurts)
The most common reason solo builders skip external monitoring is simple: it feels like a "big-company" concern. You have one server, one provider, and maybe a few hundred users. But OpenAI's infrastructure is a shared, multi-tenant system. A model update, a capacity rebalance, or a regional routing change can double your p95 latency overnight, and the OpenAI status page may not reflect it for hours.
Without probes, you are relying on two unreliable signals: your own manual testing (which happens from one location, during working hours) and user complaints (which arrive late and lack diagnostic detail). A properly configured probe gives you a third, objective signal: a repeatable request from a known region, measured at a known time, compared against a known baseline.
The cost of not having this signal is concrete. Imagine you deploy a new feature on Monday morning. On Tuesday, your European users start experiencing three-second TTFT instead of the usual 800 ms. You do not notice until Wednesday afternoon when a support email arrives. By then you have lost two days of user trust, and you still do not know whether the problem is your code, your hosting region, or OpenAI itself. A single daily probe from an EU region would have flagged the regression on Tuesday at 06:00 UTC.
Step-by-step: filling out your probe configuration worksheet
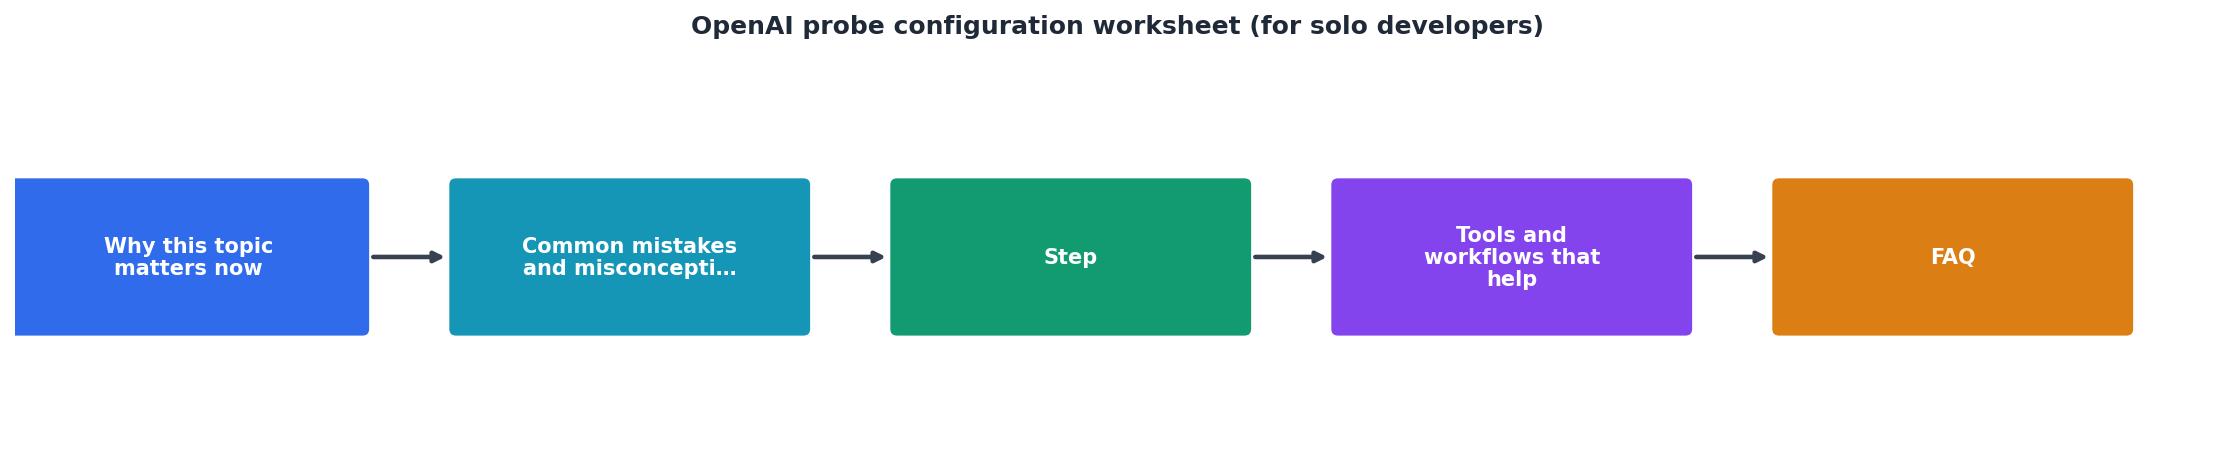
Follow these seven steps to go from zero probes to a working latency monitoring setup. Each step includes the exact decision you need to make and a recommended default for solo projects.
Step 1, Choose your primary model
Write down the exact model ID you use in production (e.g., gpt-4o, gpt-4o-mini, gpt-3.5-turbo). If you use more than one, pick the one that handles user-facing, latency-sensitive requests. You will add the others later.
Worksheet field: primary_model = _______________
Step 2, Identify your users' top two regions
Check your analytics or CDN logs for the two geographic regions that generate the most traffic. If you do not have analytics yet, use your server's region plus one additional region where you expect growth. Common pairs for solo projects: us-east + eu-west, or ap-southeast + us-west.
Worksheet fields:
region_1 = _______________region_2 = _______________
Step 3, Define a standard probe prompt
Your probe prompt should be short, deterministic, and representative of your real workload. Avoid creative or open-ended prompts, they produce variable-length responses that make latency comparison noisy. A good default:
Respond with exactly one sentence summarizing the current date.
Keep max_tokens fixed (e.g., 50) and temperature at 0. This ensures every probe produces a response of similar length, making TTFB and TTFT measurements comparable across days.
Worksheet fields:
probe_prompt = _______________max_tokens = _______________temperature = 0
Step 4, Set your probe frequency
For solo developers, once per day per region is a practical starting point. It is enough to catch multi-hour degradations without burning API credits. If you are on a paid monitoring tool like Observinio, daily probes from 21 regions are included automatically, you do not need to manage cron jobs or Lambda functions.
Worksheet field: frequency = daily | hourly | every_6h
Step 5, Collect one week of baseline data
Run your probes for seven consecutive days before setting any alert thresholds. Record the median and p95 TTFB and TTFT for each region. This baseline accounts for normal day-to-day variance (weekday traffic peaks, model serving fluctuations, etc.).
Worksheet fields (fill after seven days):
| Region | Median TTFB (ms) | p95 TTFB (ms) | Median TTFT (ms) | p95 TTFT (ms) |
|---|---|---|---|---|
region_1 | ___ | ___ | ___ | ___ |
region_2 | ___ | ___ | ___ | ___ |
Step 6, Calculate alert thresholds
Multiply your p95 baseline by 1.5 to get a sensible alert threshold. This avoids false alarms from normal jitter while still catching meaningful regressions. For example, if your p95 TTFT from eu-west is 900 ms, set the alert at 1,350 ms.
Worksheet fields:
alert_threshold_region_1 = p95 × 1.5 = _____ msalert_threshold_region_2 = p95 × 1.5 = _____ ms
Step 7, Configure your alert channel
As a solo developer, email is usually the most reliable channel, you will see it on your phone without extra tooling. Avoid Slack-only alerts; solo builders often mute Slack on weekends, which is exactly when unattended regressions happen.
Worksheet field: alert_email = _______________
Choosing regions: think like your users, not like your server

A common mistake is probing only from the region where your backend runs. Your backend's outbound request to OpenAI may be fast because it sits close to OpenAI's US data centers. But your user in São Paulo or Mumbai experiences a completely different latency profile, their browser hits your server (one hop), your server hits OpenAI (second hop), and the response travels back through both hops.
Observinio solves this by running probes from 21 regions simultaneously, so you see the latency your users actually experience, not just the latency your server sees. If you are building a DIY setup instead, at minimum add one probe from a region far from your server. The delta between your "local" probe and your "remote" probe is often the most revealing metric in your entire monitoring stack.
Here is a quick reference for region selection based on common solo-developer architectures:
- Server in US-East (Virginia): Add probes from
eu-west-1(Ireland) andap-southeast-1(Singapore). - Server in EU-West (Frankfurt): Add probes from
us-east-1(Virginia) andap-northeast-1(Tokyo). - Server in AP-Southeast (Singapore): Add probes from
us-west-2(Oregon) andeu-west-1(Ireland). - Serverless / edge (Vercel, Cloudflare Workers): Probe from at least three continents, since your function may execute anywhere.
Reading your probe results: what to look for each week
Once your probes are running, spend five minutes each Monday reviewing the weekly data. Use the following checklist:
Your progress is saved automatically in your browser.
"To solve the 50% complicated debugging and testing scenarios, expertise from a senior engineer is still required.">, Learning of Solo
This quote resonates strongly with probe configuration. Automated monitoring handles the straightforward cases, "latency went up, send an alert." But interpreting why latency changed, deciding whether to switch models, or determining if the issue is transient still requires your judgment. The probe data gives you the evidence; you supply the expertise.
Common mistakes solo developers make with probes
Avoid these pitfalls when setting up your first monitoring configuration:
- Using a creative prompt as the probe payload. Variable-length responses make TTFT measurements noisy. Stick to deterministic, short prompts.
- Setting thresholds too tight. A threshold at 1.1× baseline will fire constantly and train you to ignore alerts. Start at 1.5× and tighten only after you have a month of clean data.
- Probing only during business hours. If your users are global, your probes should run around the clock. A daily probe at a fixed UTC time is better than a manual check at 10 AM your local time.
- Forgetting to update baselines after model changes. When OpenAI releases a new model version (e.g.,
gpt-4oupdates), your old baseline is invalid. Re-run the seven-day baseline collection. - Monitoring only one metric. TTFB and TTFT tell different stories. Capture both, or you will miss half the failure modes.
Key takeaway: A single daily probe with a deterministic prompt, fixed token limit, and a 1.5× p95 alert threshold gives a solo developer more actionable latency insight than any amount of manual spot-checking, and it takes less than five minutes to set up.
Completed worksheet example
Here is a filled-out worksheet for a solo developer running a customer-support chatbot on Vercel with users primarily in North America and Europe:
| Field | Value |
|---|---|
primary_model | gpt-4o-mini |
region_1 | us-east-1 |
region_2 | eu-west-1 |
probe_prompt | "Respond with exactly one sentence summarizing the current date." |
max_tokens | 50 |
temperature | 0 |
frequency | daily |
alert_threshold_region_1 | 1,050 ms (p95 700 ms × 1.5) |
alert_threshold_region_2 | 1,350 ms (p95 900 ms × 1.5) |
alert_email | dev@myapp.com |
Frequently Asked Questions
gpt-4o for chat and gpt-4o-mini for background summarization, probe gpt-4o first. Add the second model only after your first probe is stable and you have reviewed at least one week of data.max_tokens set to 50 costs fractions of a cent. Running one probe per day across two regions costs roughly $0.01–$0.03 per month on gpt-4o-mini, depending on the exact token count. If you use Observinio, the probe requests are made from the platform's infrastructure, so they do not consume your own API quota.Ready to configure your probes?
Visit the Observinio status dashboard to see live latency data from 21 global regions, then set up your first probe in under five minutes.
View live status dashboardStart monitoring before the next incident
You do not need a platform team or a complex observability stack to keep tabs on OpenAI latency. Print this worksheet, fill it out in five minutes, and configure your probes today. If you want to skip the DIY cron jobs and get daily probes from 21 global regions with automatic baseline comparison and email alerts, Observinio's status page shows live data you can review right now, and setup takes less time than reading this article did.
Additional Resources
- Learning of Solo-Development with AI - In this article I will share some learnings of working with AI to bring a real world project from 0 to 1. Debugging and Testing: AI can ...
- Introducing GPT‑5 for developers - Introducing GPT-5 in our API platform—offering high reasoning performance, new controls for devs, and best-in-class results on real coding ...
- GPT 5.1 for Developers: What OpenAI Isn't Telling Solo Devs - OpenAI just dropped GPT 5.1 for developers. In this video, I break down what OpenAI isn't saying about 5.1 just a real solo dev read on the ...
Monitor AI API latency from 22 regions
Observinio runs daily probes against OpenRouter and OpenAI endpoints and emails you when latency degrades.
Set up alerts