OpenAI probe configuration worksheet (for enterprise teams)
Running OpenAI completions in production across multiple regions is straightforward, until the first time a customer in Frankfurt reports two-second TTFB while your US-East dashboard shows everything green. Enterprise teams need a repeatable, auditable way to configure synthetic probes that catch regional degradation before it becomes a support ticket. This worksheet walks you through every decision point, from endpoint selection to alert-threshold math, so your next probe rollout is deliberate rather than ad-hoc.

Photo by Jeswin Thomas from Pexels
Running OpenAI completions in production across multiple regions is straightforward, until the first time a customer in Frankfurt reports two-second TTFB while your US-East dashboard shows everything green. Enterprise teams need a repeatable, auditable way to configure synthetic probes that catch regional degradation before it becomes a support ticket. This worksheet walks you through every decision point, from endpoint selection to alert-threshold math, so your next probe rollout is deliberate rather than ad-hoc.
TL;DR
- Define which OpenAI endpoints and models each probe should target, mixing chat completions with embeddings in one probe creates noisy baselines.
- Choose probe regions based on where your actual users are, not where your infrastructure lives.
- Set TTFB and TTFT thresholds relative to a measured baseline, not arbitrary round numbers.
- Assign ownership for each probe to a specific on-call rotation or team channel.
- Review probe configuration quarterly; model updates and routing changes silently shift latency profiles.
Why enterprise teams need a formal probe worksheet
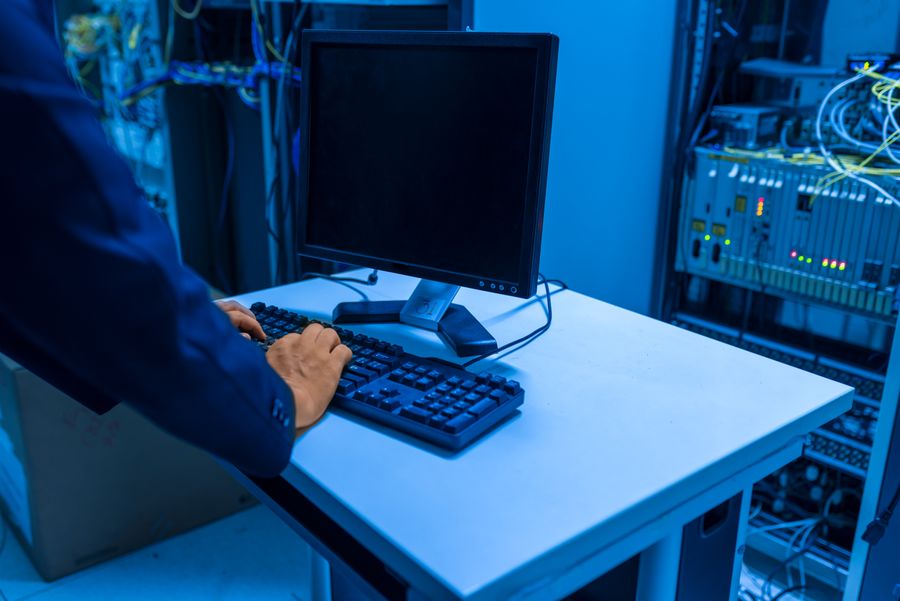
Most smaller teams can get away with a single synthetic probe hitting https://api.openai.com/v1/chat/completions from one region and eyeballing the results. Enterprise environments are different. You may have dozens of internal products consuming OpenAI through a shared gateway, each with its own latency SLO. Without a structured worksheet, probe configurations drift: someone adds a probe for a demo, nobody removes it, alert fatigue sets in, and the probes that matter get ignored alongside the ones that don't.
A worksheet forces three things:
- Explicit scope, which endpoints, models, and regions are covered.
- Defined ownership, who gets paged, who reviews weekly summaries.
- Threshold rationale, why the alert fires at 800 ms and not 500 ms or 1200 ms.
Step-by-step: filling out the worksheet
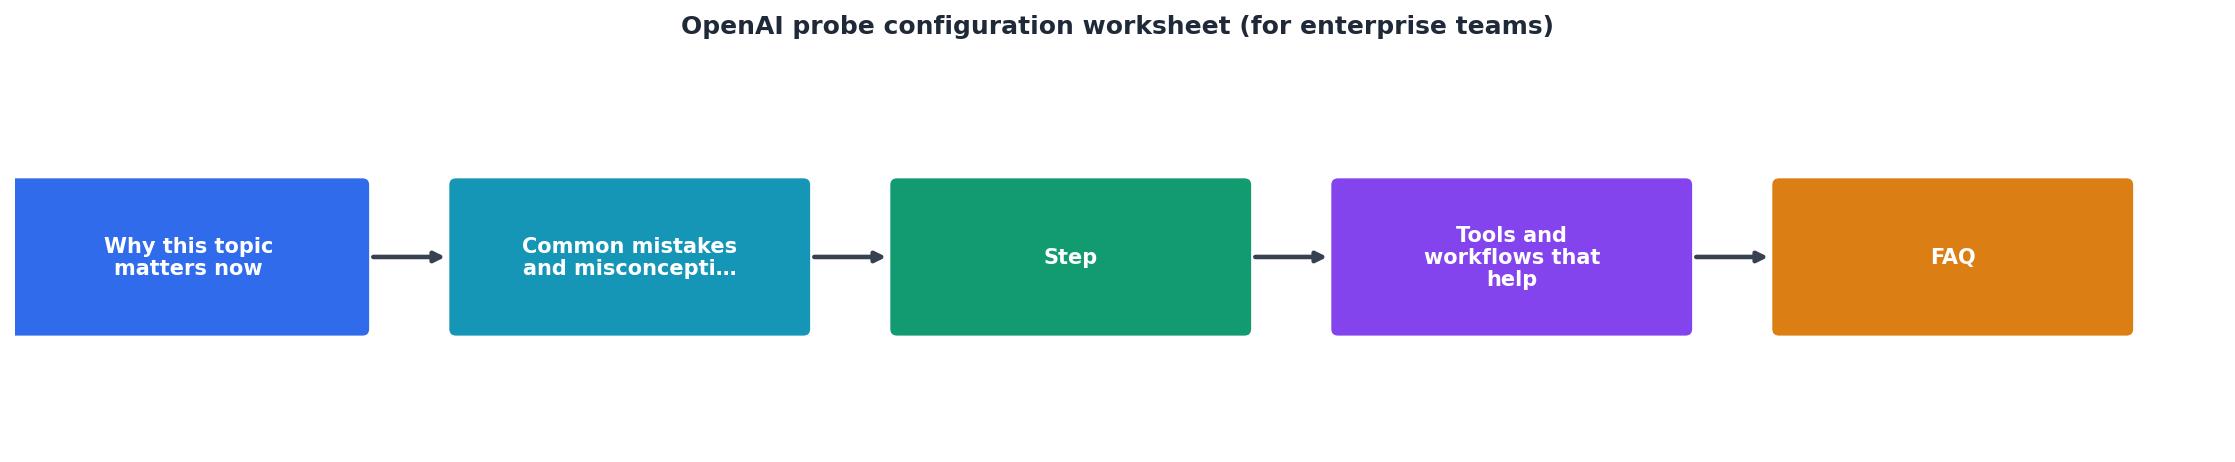
Follow these steps in order. Each step produces a concrete artifact, a table row, a threshold number, or an ownership assignment, that feeds into the final configuration.
Step 1: Inventory your OpenAI endpoints
List every distinct OpenAI API call your production systems make. Be specific about the model and the endpoint path. A single application might use gpt-4o for chat, gpt-4o-mini for summarization, and text-embedding-3-small for vector search. Each of these has a different latency profile and deserves its own probe.
Create a table like this:
| Probe ID | Endpoint path | Model | Typical prompt size | Internal consumer |
|---|---|---|---|---|
| P-01 | /v1/chat/completions | gpt-4o | ~500 tokens | Customer chat service |
| P-02 | /v1/chat/completions | gpt-4o-mini | ~200 tokens | Summarization pipeline |
| P-03 | /v1/embeddings | text-embedding-3-small | ~150 tokens | Search indexer |
Step 2: Select probe regions
Do not probe from every available region just because you can. Start with the regions where your users actually are. Pull geographic data from your analytics or CDN logs and rank the top five to eight regions by request volume.
For each region, note whether you route through OpenAI directly or through a gateway like OpenRouter. If you use both paths, you need separate probes for each, the routing layer adds measurable latency that varies by region.
Observinio supports 21 regions out of the box. A practical enterprise starting set might look like:
- US-East (primary user base)
- US-West (secondary data center)
- EU-West / Frankfurt (GDPR-regulated traffic)
- AP-Southeast / Singapore (APAC customers)
- AP-Northeast / Tokyo (APAC customers, different routing path)
Step 3: Establish baselines before setting thresholds
This is where most teams go wrong. They pick a round number, "alert if TTFB exceeds 1000 ms", without knowing what normal looks like. Run your probes for at least seven days without any alerting enabled. Collect the p50, p90, and p99 TTFB and TTFT values for each probe-region combination.
Record baselines in a table:
| Probe ID | Region | p50 TTFB (ms) | p90 TTFB (ms) | p99 TTFB (ms) |
|---|---|---|---|---|
| P-01 | US-East | 210 | 380 | 620 |
| P-01 | EU-West | 340 | 510 | 870 |
| P-01 | AP-Southeast | 420 | 680 | 1100 |
Step 4: Define ownership and escalation
Every probe needs an owner. In enterprise environments, "the platform team" is not specific enough. Assign:
- Primary owner: the on-call engineer or rotation that receives the initial degradation alert.
- Escalation contact: the team lead or manager who gets notified if the alert is unacknowledged after 15 minutes.
- Weekly reviewer: the person who reads the Observinio weekly summary email and flags trends.
"Most of these permissions are application permissions, which let the approved connection operate without requiring every member to sign in individually.The requested permissions can include:.">, Microsoft Teams app and setup in ChatGPT
If your team uses Microsoft Teams or Slack for incident coordination, make sure the alert channel is documented in the worksheet alongside the probe ID. This eliminates the "who owns this alert?" question during an incident.
Step 5: Document the probe payload
Your synthetic probe should mimic real traffic as closely as possible without generating excessive cost. Document the exact JSON payload each probe sends. Here is an example for a chat completions probe:
{
  "model": "gpt-4o",
  "messages": [
    {
      "role": "system",
      "content": "You are a helpful assistant."
    },
    {
      "role": "user",
      "content": "Summarize the key benefits of synthetic API monitoring in two sentences."
    }
  ],
  "max_tokens": 100,
  "temperature": 0
}
Key decisions to document:
max_tokens: keep it low enough to control cost but high enough to measure TTFT accurately. 50–150 tokens is a reasonable range for probes.temperature: set to0for deterministic responses, which makes it easier to spot anomalies in response content.stream: if your production code uses streaming, your probe should too, streaming TTFT behaves differently from non-streaming response times.
Step 6: Set a review cadence
Probe configurations are not set-and-forget. Schedule a quarterly review that covers:
- Model changes, did OpenAI deprecate or update a model you are probing?
- Region shifts, has your user base grown in a region you are not probing?
- Threshold drift, have baselines shifted enough that your 1.5× multiplier needs recalculation?
- Cost audit, are probe calls generating unexpected spend?
Enterprise probe configuration checklist
Use this checklist before activating any new probe in production:
Your progress is saved automatically in your browser.
Common mistakes to avoid
| Mistake | Why it matters | Fix |
|---|---|---|
| Probing only from your cloud region | Tells you nothing about user-perceived latency in other geographies | Probe from where your users are, not where your servers are |
| Using a trivial prompt | A two-token response hides TTFT regressions that affect real conversations | Match probe prompt size to your actual production traffic |
| Ignoring streaming vs. non-streaming | TTFT is measured differently for each mode, mixing them creates confusion | Create separate probes for streaming and non-streaming endpoints |
| Same threshold for every region | Singapore-to-US latency is inherently higher than Virginia-to-US | Set region-specific thresholds based on measured baselines |
| No ownership rotation | Alerts go to a dead email when the owner leaves the team | Tie ownership to an on-call rotation, not an individual |
Frequently Asked Questions
Key takeaway: A structured probe worksheet transforms OpenAI latency monitoring from reactive firefighting into proactive engineering. By inventorying endpoints, measuring region-specific baselines, setting data-driven thresholds at 1.5× the p90, and assigning clear ownership, enterprise teams catch degradation before users notice it and maintain confidence in their AI-powered products across every geography they serve.
Start monitoring with confidence
A well-configured probe setup turns latency monitoring from guesswork into engineering. If your team is ready to move beyond ad-hoc checks, Observinio's status page and degradation email alerts give you the measurement layer, this worksheet gives you the operational discipline to use it effectively. Set up your first probes, collect baselines, and let the data drive your thresholds.
Additional Resources
- Microsoft Teams app and setup in ChatGPT - Connect Microsoft Teams to ChatGPT, review Microsoft permissions, and configure administrator-managed Teams sync for an eligible workspace.
- Introducing ChatGPT Enterprise - We're launching ChatGPT Enterprise, which offers enterprise-grade security and privacy, unlimited higher-speed GPT‑4 access, longer context ...
- Connect to and manage ChatGPT Enterprise AI ... - This article outlines how to register ChatGPT Enterprise workspaces as a data source in Microsoft Purview. This connector allows you to ...
Monitor AI API latency from 22 regions
Observinio runs daily probes against OpenRouter and OpenAI endpoints and emails you when latency degrades.
Set up alerts