Multi-provider failover decision tree
When your production LLM call fails at 3 AM, the last thing you want is a Slack thread debating which provider to try next. A well-designed failover decision tree removes that guesswork: it encodes latency thresholds, error classes, and regional context into a deterministic flow that your code, or your on-call engineer, can follow in seconds. This guide walks you through building one from scratch, with concrete thresholds, pseudocode, and a checklist you can adapt to any multi-provider stack.

Photo by panumas nikhomkhai from Pexels
When your production LLM call fails at 3 AM, the last thing you want is a Slack thread debating which provider to try next. A well-designed failover decision tree removes that guesswork: it encodes latency thresholds, error classes, and regional context into a deterministic flow that your code, or your on-call engineer, can follow in seconds. This guide walks you through building one from scratch, with concrete thresholds, pseudocode, and a checklist you can adapt to any multi-provider stack.
TL;DR
- A failover decision tree maps every possible API failure mode (timeout, 5xx, rate limit, degraded TTFB) to a specific next action, retry, reroute, or alert.
- Classify failures into three buckets: hard errors, soft degradation, and regional anomalies. Each bucket needs a different response.
- Use real latency baselines, not provider SLA documents, to set thresholds. Daily probes from multiple regions give you the ground truth.
- Encode the tree in code (not a wiki page) so failover happens automatically and consistently.
- Test the tree regularly with chaos experiments; a failover path you have never exercised is a failover path that does not work.
Why single-provider architectures break

Most teams start with a single LLM provider, OpenAI direct, or a routing layer like OpenRouter, and that works fine until it doesn't. The failure modes are well-documented at this point: regional capacity limits that spike TTFB from 200 ms to 4 seconds, rate-limit walls during traffic bursts, and full outages that return 503s for minutes at a time.
The core problem is that LLM APIs are stateless HTTP endpoints with no built-in failover semantics. Unlike a managed database with automatic replica promotion, a chat completion call either succeeds or it doesn't. Your application code owns the retry and reroute logic entirely.
A single-provider setup also hides regional variance. If your users are in Frankfurt and your provider's nearest inference cluster is in Virginia, you are paying a 100–140 ms round-trip penalty on every request before the model even starts generating tokens. When that Virginia cluster degrades, your European users experience compounding latency, network round-trip plus queuing delay, while your US-East users might see only a minor slowdown. Without multi-region probing data, you cannot distinguish between "the provider is slow everywhere" and "the provider is slow for my region."
"For enterprise applications, specifically those in customer support, financial analysis, or real-time decision-making, 99.9% uptime is often a contractual requirement.">, How to Build Multi
Meeting that 99.9% bar with a single provider is mathematically difficult. If your primary provider delivers 99.5% availability on its own, you need a secondary path that covers the remaining gap. A decision tree is the mechanism that activates that secondary path at the right moment, not too early (wasting quota and money) and not too late (users already churning).
Classifying failure modes
Before you can build a tree, you need a taxonomy of what can go wrong. Not all failures are equal, and treating a rate-limit 429 the same as a network timeout leads to poor failover behavior.
| Failure class | Signal | Action | Max retries |
|---|---|---|---|
| Hard error | HTTP 500/502/503, connection refused, DNS failure | Immediate failover | 1 |
| Soft degradation | TTFB exceeds 2× p95 baseline | Complete in-flight, reroute next request | 0 (reroute) |
| Rate limit | HTTP 429 with Retry-After header | Wait if under budget, else failover | 1 |
| Regional anomaly | Regional TTFB spike, global TTFB normal | Regional reroute only | 0 (reroute) |
Hard errors
These are unambiguous: HTTP 500, 502, 503, connection refused, DNS resolution failure, or TLS handshake timeout. The provider is down or unreachable. Action: immediately route to the next provider in your priority list. Do not retry the same endpoint more than once for hard errors, you are burning time.
Soft degradation
The provider responds, but slowly. TTFB (time to first byte) or TTFT (time to first token for streaming endpoints) exceeds your baseline by a defined multiplier, commonly 2× to 3×. The response might still complete, but user experience suffers. Action: complete the in-flight request if it is already streaming, but route the next request to an alternative provider. Set a cooldown timer (e.g., 60 seconds) before re-checking the primary.
Rate limits
HTTP 429 with a Retry-After header. The provider is healthy but you have exhausted your quota. Action: if Retry-After is under your latency budget (say, under 5 seconds), wait and retry. If it exceeds the budget, failover immediately. Log the event, frequent 429s mean you need a higher tier or better request spreading.
Regional anomalies
The provider is fine globally but degraded in your region. This is the hardest category to detect without external data. If you probe from a single location, a regional issue looks like a global outage. Action: route affected regions to a provider with better regional performance, while keeping the primary for unaffected regions.
Building the decision tree step by step
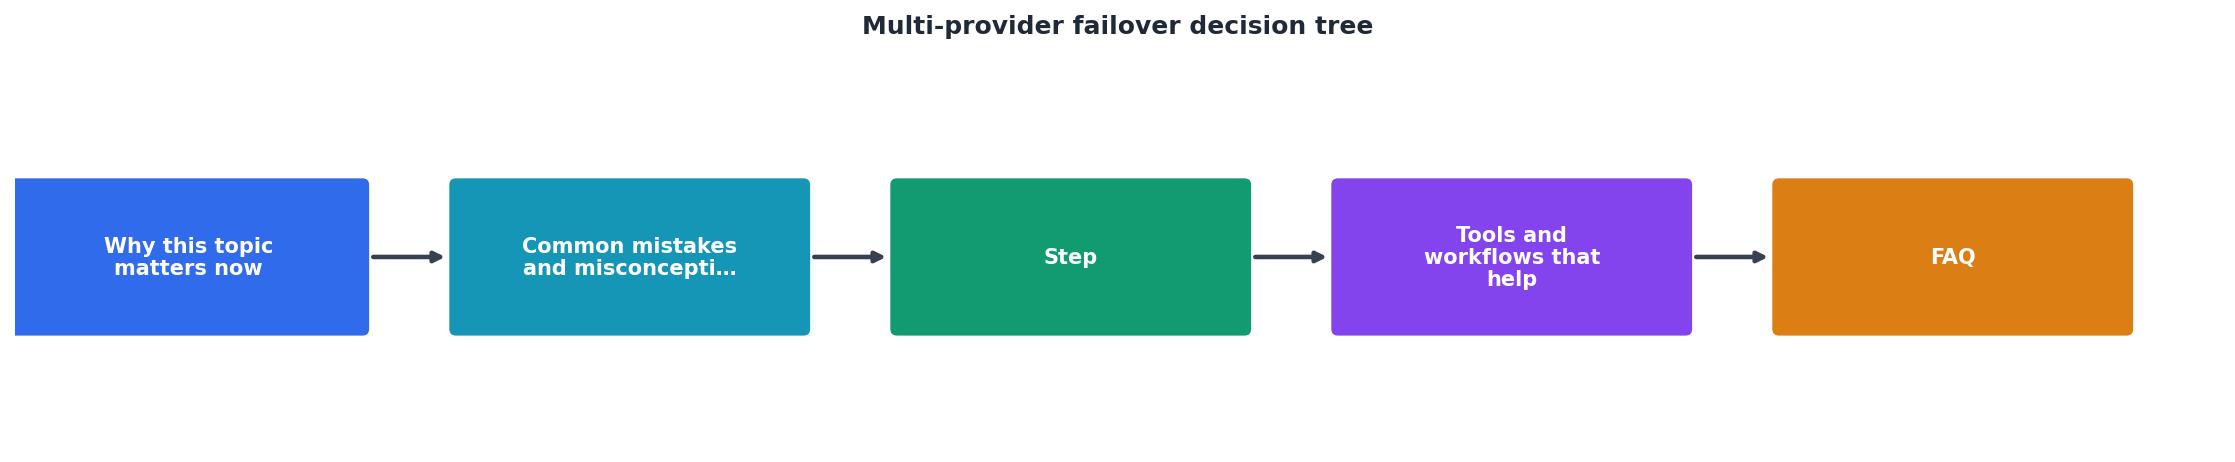
The following numbered steps walk you through constructing a failover decision tree that covers the failure classes above. Each step produces a concrete artifact, a threshold, a code branch, or a configuration value.
- Establish latency baselines. Before you can detect degradation, you need to know what "normal" looks like. Collect TTFB and TTFT percentiles (p50, p95, p99) for each provider from every region your users occupy. Daily synthetic probes are ideal here, they give you a consistent, user-independent measurement. Record baselines over at least two weeks to capture weekday/weekend variance.
- Define threshold multipliers. Set a degradation threshold as a multiplier of your p95 baseline. A common starting point: if current TTFB exceeds 2× the p95 baseline for that region and provider, classify the request as "soft degradation." If it exceeds 4× or times out entirely, classify as "hard error." These multipliers are tunable, start conservative and tighten as you gain confidence.
- Rank your providers. Create a priority list per region. For example, in
eu-west, your primary might be OpenAI direct (lower TTFB from European inference nodes) and your secondary might be OpenRouter (broader model access, slightly higher latency). Inus-east, the ranking might reverse. Base these rankings on your baseline data, not on marketing claims.
- Implement the decision function. In pseudocode:
function route_request(region, model, attempt = 1):
    provider = get_priority_provider(region, model, attempt)
    if provider is None:
        return ERROR_ALL_PROVIDERS_EXHAUSTED

response = call_provider(provider, model, timeout = baseline_p95[region][provider]  4)

if response.status == 200 and response.ttfb <= baseline_p95[region][provider]  2:
        return response  // healthy

if response.status == 429:
        if response.retry_after <= LATENCY_BUDGET:
            sleep(response.retry_after)
            return call_provider(provider, model)
        else:
            mark_provider_rate_limited(provider, duration = response.retry_after)
            return route_request(region, model, attempt + 1)

if response.status >= 500 or response.timed_out:
        mark_provider_down(provider, cooldown = 60s)
        return route_request(region, model, attempt + 1)

if response.ttfb > baseline_p95[region][provider] * 2:
        mark_provider_degraded(provider, region, cooldown = 60s)
        return route_request(region, model, attempt + 1)
- Add circuit breakers. The
mark_provider_downandmark_provider_degradedcalls above act as circuit breakers. Once tripped, subsequent requests skip that provider for the cooldown duration. After cooldown, send a single probe request (a lightweight completion call) to test recovery before restoring full traffic. This prevents a recovering provider from being overwhelmed by a traffic stampede.
- Set a maximum attempt count. The
attemptparameter prevents infinite recursion. With two providers, cap at 3 attempts (primary, secondary, one retry of whichever recovered first). With three providers, cap at 4. Every additional attempt adds latency, so keep the cap tight.
- Log every decision node. Every branch in the tree, every timeout, every failover, every circuit-breaker trip, must emit a structured log event. These logs are your incident timeline. Without them, your postmortem is guesswork.
Monitoring the tree itself

A failover tree is only as good as the data feeding it. Stale baselines lead to false positives (failover when the provider is fine) or false negatives (no failover when the provider is degraded). You need continuous, multi-region latency data to keep thresholds accurate.
Key metrics to track
- Failover rate: percentage of requests that hit a non-primary provider. A sudden spike means your primary is degrading. A sustained high rate means your baselines or rankings need updating.
- Failover latency overhead: the additional time a request takes when it fails over versus when it succeeds on the primary. This tells you the real cost of your safety net.
- Circuit-breaker trip frequency: how often each provider gets marked down or degraded, broken down by region. Patterns here inform provider negotiations and architecture decisions.
- Recovery detection time: how long after a provider recovers before your tree starts routing traffic back. Long recovery times mean your cooldown or probe logic needs tuning.
Refreshing baselines
Baselines drift. Providers upgrade infrastructure, change routing, or shift capacity between regions. Re-calculate your p50/p95/p99 baselines weekly using the most recent 14 days of probe data. Automate this, manual baseline updates do not survive the first busy quarter.
Pre-flight checklist

Use this checklist before deploying your failover tree to production:
Your progress is saved automatically in your browser.
Common mistakes to avoid
Treating all errors as transient. Retrying a 503 three times with exponential backoff adds 15+ seconds of latency before you even attempt a failover. Classify first, then act. Hard errors get one retry at most.
Using global baselines for regional decisions. A provider's global average TTFB might be 250 ms, but from ap-southeast it could be 600 ms. If your threshold is based on the global number, you will never detect degradation in Asia-Pacific, it always looks "slow" relative to the global baseline, so the threshold never triggers.
Forgetting to test the secondary path. If your secondary provider's API key is expired, your rate limit is zero, or your model mapping is wrong, you will discover this during an incident. Run a small percentage of production traffic (1–5%) through the secondary path continuously. This validates the path and keeps your baselines for the secondary provider fresh.
Hardcoding provider rankings. Static rankings become stale. A provider that was fastest in eu-west six months ago may have shifted capacity. Use your weekly baseline refresh to re-rank automatically, or at minimum flag when rankings should change.
Frequently Asked Questions
mark_provider_down mechanism prevents subsequent requests from hitting a known-bad provider.eu-west but remains normal in us-east and ap-southeast, that is a regional issue. If all regions spike, it is global. This distinction matters because regional degradation calls for regional rerouting (send European traffic to a different provider) while global degradation calls for full failover. Multi-region synthetic probes are the standard way to make this distinction in near-real-time.Keep your decision tree sharp with real data
A failover decision tree is only as reliable as the latency baselines powering it. Observinio probes OpenRouter and OpenAI endpoints from 21 global regions daily, calculates baseline comparisons automatically, and sends email alerts when response times degrade beyond your thresholds. Instead of maintaining your own probing infrastructure, you can plug Observinio's status page data and weekly summaries directly into your threshold calculations, keeping your tree calibrated with minimal operational overhead. Set up degradation alerts and let the data drive your failover logic.
Additional Resources
- How to Build Multi-Provider Failover Strategies with Bifrost ... - This guide details how to architect and implement ultra-reliable multi-provider failover strategies using Bifrost, Maxim AI's high-performance, ...
- How do you configure OmniRoute for multi-provider failover? - List providers in your routing config by order (OpenAI first, then Anthropic, then Google). The router switches to the next if one fails.
- Multi-Provider LLM Routing Is Not a Problem, It's Your ... - The routed lane fails over and completes, and the user on that lane never learns a failover happened; it shows up only in the decision log.
Monitor AI API latency from 22 regions
Observinio runs daily probes against OpenRouter and OpenAI endpoints and emails you when latency degrades.
Set up alerts