Model upgrade latency regression test plan
When an AI provider deploys a new model version, inference latency rarely stays flat. A routing algorithm tweak, tokenizer update, or infrastructure change can shift Time-to-First-Byte (TTFB) or Time-to-First-Token (TTFT) by tens or hundreds of milliseconds, sometimes per region. Without a structured regression test plan, you discover these shifts via user complaints or support tickets, not monitoring. This guide walks you through building a regression test plan that catches latency regressions

When an AI provider deploys a new model version, inference latency rarely stays flat. A routing algorithm tweak, tokenizer update, or infrastructure change can shift Time-to-First-Byte (TTFB) or Time-to-First-Token (TTFT) by tens or hundreds of milliseconds, sometimes per region. Without a structured regression test plan, you discover these shifts via user complaints or support tickets, not monitoring. This guide walks you through building a regression test plan that catches latency regressions before they degrade production experience.
TL;DR
- Define baseline metrics before deployment. Capture TTFB, TTFT, and per-region latency for the current model across all your active regions (e.g., US-East, EU-West, Asia-Pacific).
- Test from multiple regions simultaneously. Latency regression is often regional; a Europe upgrade might not affect US performance, but you'll miss it without distributed probes.
- Set explicit pass/fail thresholds. Don't use gut feel; lock in acceptance criteria (e.g., "95th-percentile TTFB must not increase by more than 50 ms") before testing begins.
- Automate daily or post-deployment probes. Manual testing is too slow; use synthetic probes from your monitoring stack to catch degradation within hours of a release.
- Compare against baseline, not just limits. A model upgrade might be slower than the old version but still within SLO; know the difference between acceptable and regressed.
Why regression testing matters for model upgrades
Model upgrades are inherently risky for latency. Unlike code deployments where you control execution logic end-to-end, inference latency depends on provider infrastructure you cannot see. A new model might:
- Use a larger tokenizer, increasing token count and TTFT for the same prompt.
- Run on newer hardware with different memory hierarchies, changing cache efficiency.
- Include quantization or pruning, shifting compute per token.
- Deploy to regions unevenly, causing cross-region imbalance in response times.
Establish your baseline before deployment
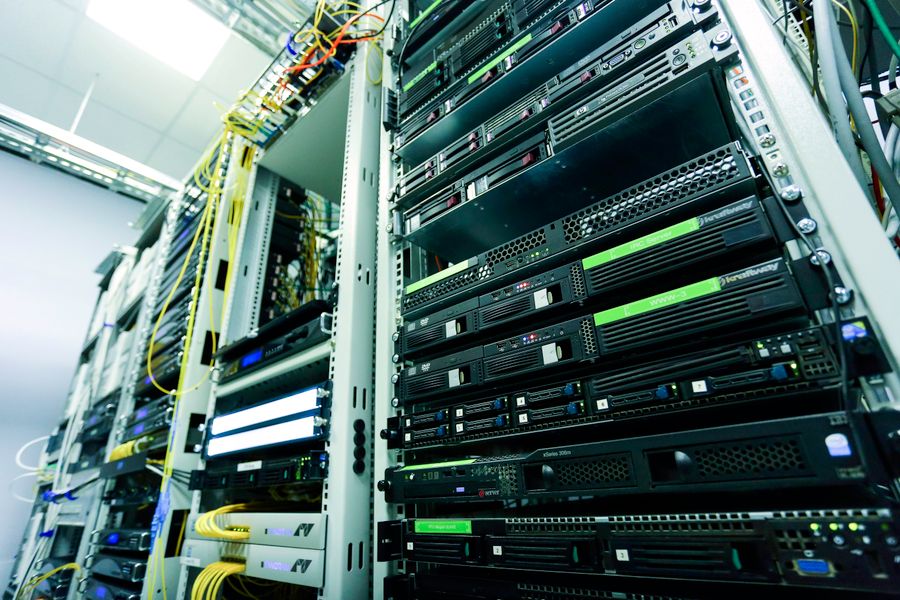
A baseline is a snapshot of current performance. Without one, you cannot measure regression. Create your baseline from real production traffic or representative synthetic load at least 1–2 weeks before a scheduled upgrade.
Baseline data to collect
- Time-to-First-Byte (TTFB): Elapsed time from request send to first byte received. Dominated by provider processing and network latency.
- Time-to-First-Token (TTFT): Time from request to first token in the completion. More granular than TTFB for generative workloads; reflects model initialization and prefill phase.
- End-to-End (E2E) latency: Total time for a full response, including streaming overhead.
- P50, P95, P99 percentiles: Baselines must capture tail latency, not just mean. A 200 ms increase at P99 is a regression even if the median is stable.
- Per-region breakdown: If you serve users globally, latency varies by geography. Collect separate baselines for US-East, EU-West, Asia-Pacific, etc. (Observinio captures these across 21 regions if you use its probes.)
- Per-model latency: If you test multiple models (GPT-4, Claude, Llama), establish independent baselines.
How to gather baseline data
- Option A: Export existing APM metrics from the past week. If you use Datadog, New Relic, or similar, query response times for your model endpoint.
- Option B: Use Observinio or similar synthetic probe service to capture latency from your exact regions daily for 7–14 days before the upgrade date.
- Option C: Instrument your application to log TTFB/TTFT for every request; aggregate at the end of the week.
Model: gpt-4-turbo-v2 (current)
Capture Date: 2025-02-01 to 2025-02-14
Region: US-East-1
  TTFB P50: 145 ms
  TTFB P95: 320 ms
  TTFB P99: 610 ms
  TTFT P50: 210 ms
  TTFT P95: 480 ms
  TTFT P99: 920 ms
  Samples: 1,247,500

Region: EU-West-1
  TTFB P50: 210 ms
  TTFB P95: 405 ms
  TTFB P99: 750 ms
  TTFT P50: 290 ms
  TTFT P95: 620 ms
  TTFT P99: 1,100 ms
  Samples: 643,200

[... repeat for each region ...]
Store this baseline before any code or model changes. You'll compare post-upgrade metrics against it.
Define pass/fail criteria and acceptance gates

The quote below captures the essence of a good test plan:
"Criteria might include specific pass rates (99% of critical tests pass), coverage thresholds (90% of core workflows tested), or defect limits (zero critical defects in regression areas).">, How to Build Solid Regression Test Plan (With Templates)
For latency regression, your acceptance criteria must be explicit and measurable. Vague thresholds ("it should be fast") lead to delayed rollback decisions and prolonged user impact.
Recommended acceptance criteria
Hard limits (roll back immediately if exceeded):- Any single region's P95 TTFB increases by more than 100 ms.
- Any single region's P99 E2E latency exceeds the previous P99 + 200 ms.
- Global average TTFT increases by more than 75 ms.
- P50 latency is 20–50 ms higher than baseline in any region.
- Latency variance (P99 − P50) increases by more than 30%.
- Fewer than 99.5% of requests complete within baseline P99 + 50 ms.
Define test coverage
Which workflows and regions must you test?
Workflows:- Short prompts (10–50 tokens input): Exercises tokenizer and model init.
- Medium prompts (200–500 tokens input): Represents typical chat use.
- Long prompts (2,000+ tokens input): Stresses context window and KV cache.
- Streaming vs. non-streaming: If your API supports streaming, test both code paths.
- All regions you actively serve traffic to.
- All regions where latency SLOs are published (if you use Observinio status pages, test all 21 regions or at least your top 5 by traffic).
- Baseline load: Typical QPS for your application.
- Stress load (optional): 2–3× typical QPS to see if the new model scales gracefully.
Build your regression test plan

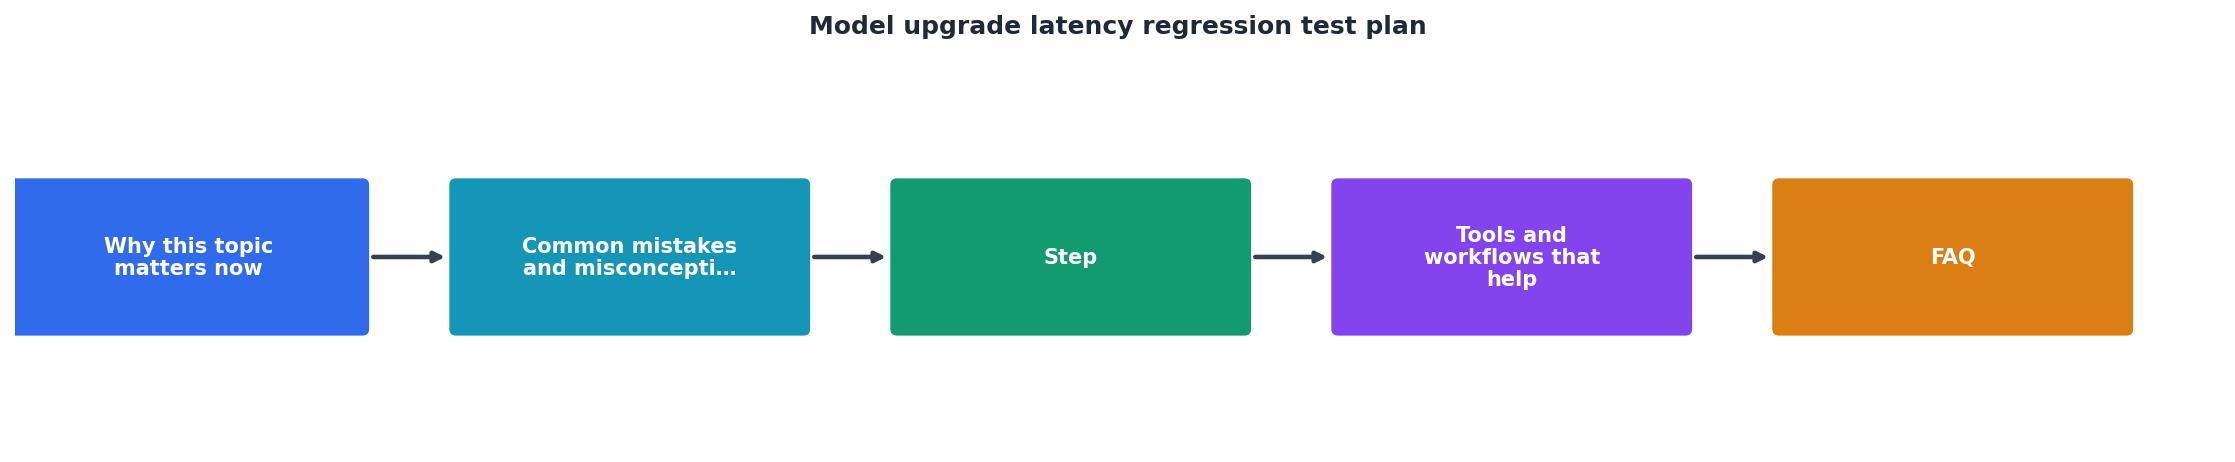
Step-by-step testing workflow
Pre-deployment (1–2 weeks before):
- Finalize baseline metrics and lock them in a shared document or database.
- Define acceptance criteria and assign owner (platform lead or SRE).
- Schedule a "dress rehearsal" if possible: run a canary in a staging environment with the same hardware specs as production to catch obvious regressions early.
- Schedule a 30–60 minute monitoring window immediately after deployment.
- Disable auto-scaling or set minimum fleet size to avoid noisy baseline shifts due to provisioning delays.
- Route 5–10% of traffic to the new model (canary). Do not go to 100% yet.
- Begin collecting TTFB, TTFT, and E2E latency from your probes or APM.
- Run synthetic probes from all key regions simultaneously. Observinio probes, for example, can send identical requests from 21 regions in parallel.
- Record minimum 500 samples per region per workflow type (short/medium/long prompt).
- Compute P50, P95, P99 latency for each region and workflow.
- Compare against baseline using a simple formula:
(new_p95 − baseline_p95) / baseline_p95 × 100% - Check whether any metric exceeds your hard limits. If yes, roll back immediately and investigate.
- If soft limits are exceeded, do not auto-promote; escalate to the team lead for decision.
- Green: All hard limits passed, soft limits acceptable. Promote to 50% traffic.
- Yellow: Soft limits exceeded. Add Observinio email alerts and monitor for 4 hours before proceeding.
- Red: Hard limits exceeded. Roll back and investigate the root cause with the provider.
- Continue probing every 4 hours for the first 24 hours.
- Set up Observinio daily probes if not already in place; configure degradation alerts for each region (e.g., "alert if TTFB > baseline P95 + 100 ms").
- Watch for time-of-day or day-of-week patterns that might reveal regional imbalance or load-dependent regression.
- Collect a full week of post-upgrade data to confirm stability.
Regression test checklist
Your progress is saved automatically in your browser.
Automate regression detection with daily probes
Manual testing is a one-time gate; automation catches silent regressions over days or weeks. Set up synthetic probes that run daily on your production model:
- Probe cadence: Once per day at off-peak hours (e.g., 02:00 UTC).
- Probe locations: All regions you serve or all 21 Observinio regions if using that service.
- Probe payload: Short, medium, and long prompts representative of real traffic.
- Alert threshold: If any region's TTFB P95 increases by > 50 ms vs. the 7-day rolling median, send an email to the on-call engineer.
- Dashboard: Plot daily TTFB/TTFT trends by region so you spot creeping degradation before it becomes critical.
0 2    python3 /opt/regression_probe.py --model gpt-4-turbo \
  --regions us-east,eu-west,ap-southeast \
  --payload-types short,medium,long \
  --sample-size 500 \
  --output /var/log/probe_results.json \
  --alert-threshold-ms 50
If using Observinio, configure a similar probe via the UI and enable email alerts for any region's latency exceeding baseline + threshold.
Common pitfalls and how to avoid them
- Comparing only means, not percentiles. Mean latency can be stable while P95 drifts. Always report P95 and P99.
- Testing from a single region. Regressions are often geographic. A US-only test misses EU slowdowns.
- Using unrealistic synthetic load. If your real traffic is bursty, test with bursts, not a flat rate.
- Skipping the baseline refresh. After a few model upgrades, establish a new baseline every 3–6 months to account for provider changes.
- Ignoring streaming overhead. If your app streams tokens, measure TTFT and streaming chunk latency, not just total E2E time.
- Rolling back too late. If a hard limit is breached at T0+30 min, roll back at T0+35 min. Waiting for more data compounds user impact.
FAQ
Frequently Asked Questions
Stay ahead of latency regressions
Model upgrades will keep happening as providers optimize performance and release new capabilities. A structured regression test plan turns these events from scary surprises into manageable milestones.
Use Observinio's 21-region probes and email alerts to automate the heavy lifting: run synthetic tests before and after upgrades, get notified of regional degradation within hours, and compare against baseline metrics without manual dashboarding. If your team relies on multiple providers or models, having a consistent regression testing routine saves weeks of incident response and confusion.
Document your acceptance criteria, lock in baselines, and test from all your active regions. Move slowly at first, a 30-minute validation window before full rollout is worth the confidence it brings.
Additional Resources
- How to Build Solid Regression Test Plan (With Templates) - This guide walks through building a regression test plan that works, including a practical template ready for immediate use.
- how to do regression testing for new upgrade? - how to do regression testing for new upgrade?
- 3 ways to optimize regression testing - For a visible upgrade to regression test efficiency levels and outcomes, begin by updating test cases that are too long, outdated, or too ...
Monitor AI API latency from 22 regions
Observinio runs daily probes against OpenRouter and OpenAI endpoints and emails you when latency degrades.
Set up alerts