Latency SLO definition worksheet
Setting a latency SLO for an AI API sounds straightforward, pick a percentile, pick a threshold, done. In practice, most teams either copy a number from a blog post that has nothing to do with their traffic pattern, or they skip the exercise entirely and react to complaints instead. This worksheet walks you through every decision you need to make, from choosing the right latency metric to defining error budgets that actually map to user experience. Fill it in once, revisit it quarterly, and you will have a defensible contract between your platform team and the rest of the organization.

Setting a latency SLO for an AI API sounds straightforward, pick a percentile, pick a threshold, done. In practice, most teams either copy a number from a blog post that has nothing to do with their traffic pattern, or they skip the exercise entirely and react to complaints instead. This worksheet walks you through every decision you need to make, from choosing the right latency metric to defining error budgets that actually map to user experience. Fill it in once, revisit it quarterly, and you will have a defensible contract between your platform team and the rest of the organization.
TL;DR
- A latency SLO requires four explicit choices: metric type, percentile, threshold, and measurement window.
- TTFB (Time to First Byte) and TTFT (Time to First Token) measure different things, pick the one your users feel.
- Regional variance can swing p95 latency by 200–400 ms across continents; a single global number hides real problems.
- Error budgets turn SLOs from aspirational targets into actionable burn-rate alerts.
- This worksheet gives you a repeatable, fill-in-the-blanks process you can complete in under an hour.
Why AI API latency needs its own SLO
Traditional REST APIs return a complete response in one round trip. LLM completion endpoints behave differently: they stream tokens over seconds, they route through intermediary layers like OpenRouter, and their latency profile shifts depending on model load, prompt length, and region. A generic "p99 < 500 ms" SLO borrowed from your payments service will not capture any of this nuance.
AI API latency also has a direct, measurable impact on user engagement. Chat interfaces feel sluggish when the first token takes more than roughly 800 ms to appear. Batch pipelines that call completion endpoints thousands of times per hour amplify even small regressions into significant cost and throughput problems. Without a purpose-built SLO, you have no shared language to describe "too slow" and no threshold to trigger investigation.
The goal of this worksheet is to give you that shared language. Each section maps to one decision. By the end, you will have a complete SLO statement you can paste into your runbook, your incident response playbook, or your Observinio alert configuration.
Step-by-step: the SLO definition process
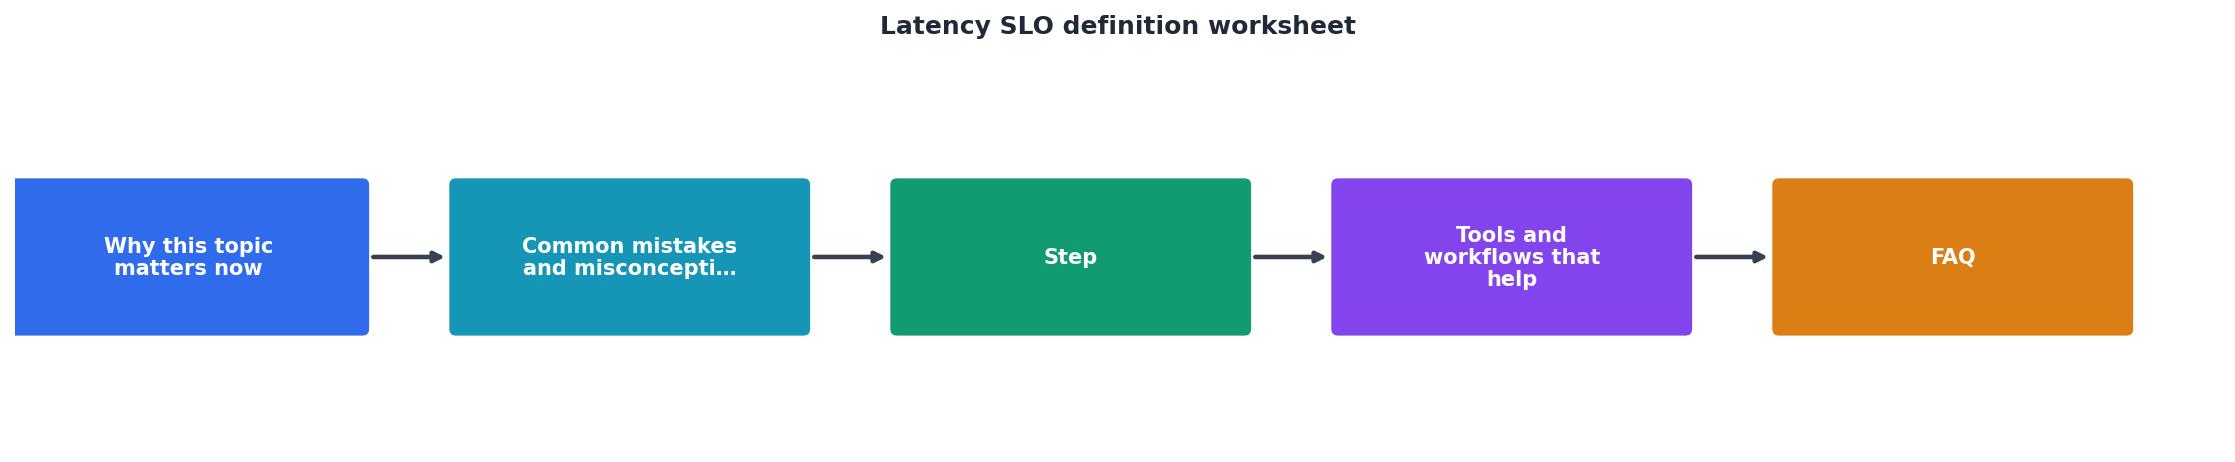
Follow these seven steps in order. Each step produces one concrete output that feeds into the next.
- Identify the user-facing journey. Write down the exact interaction path: for example, "User sends a chat message → receives streamed completion → sees full response." This anchors every later decision to something real.
- Select the latency metric. Choose between TTFB (time from request sent to first byte of response), TTFT (time from request sent to first token of generated content), or total completion time. For streaming chat, TTFT is usually the metric users feel. For batch scoring, total completion time matters more.
- Choose the percentile. p50 tells you about the typical experience; p95 captures the tail that frustrated users remember; p99 is useful for contractual SLAs but noisy for operational alerting. Most teams start with p95 for SLOs and reserve p99 for SLAs.
- Set the threshold. Base this on measured data, not guesses. Pull at least two weeks of baseline latency from your monitoring tool. If you use Observinio, the weekly summary emails give you p50 and p95 per region and per provider, start there.
- Define the measurement window. A rolling 7-day window smooths daily traffic patterns. A 30-day window aligns with monthly business reviews. Pick one and document it.
- Calculate the error budget. If your SLO is "p95 TTFT < 1 000 ms over 7 days," then 5 % of requests are allowed to exceed 1 000 ms by definition. The error budget is the remaining tolerance: for example, if you target 99.5 % of requests within threshold, your budget is 0.5 % of total requests in the window.
- Write the SLO statement. Combine everything into a single sentence: "99.5 % of chat-completion requests, measured by TTFT at p95, shall complete in under 1 000 ms over a rolling 7-day window, as observed from the EU-West region."
"The number one source of outages is change: pushing new features, applying security patches, deploying new hardware, and scaling up to meet customer demand will impact that 100% target.">, Google SRE
This quote underscores why 100 % is never the right target. Your error budget exists precisely to absorb the impact of change, deployments, provider-side model updates, and traffic spikes.
Choosing the right latency metric

Not all latency numbers are created equal. Here is a quick reference for the three metrics you will encounter most often when working with LLM APIs:
| Metric | What it measures | Best for |
|---|---|---|
| TTFB (Time to First Byte) | Network + server processing until the first byte hits the client | Detecting network-level regressions, proxy overhead |
| TTFT (Time to First Token) | Time until the first meaningful generated token arrives | Streaming chat UX, perceived responsiveness |
| Total completion time | Full duration from request to final token / [DONE] event | Batch pipelines, cost-per-request calculations |
When you route through OpenRouter, an additional hop is introduced between your client and the underlying model provider. This means TTFB and TTFT can diverge more than they would with a direct OpenAI call. Monitoring both metrics from the same region lets you isolate whether latency changes originate in the routing layer or the model itself.
Percentile selection guidelines
- p50: Use for capacity planning and cost modeling. It tells you what the "normal" request looks like.
- p95: The standard SLO percentile. It captures the experience of the frustrated minority without being dominated by one-off outliers.
- p99: Reserve for external SLAs or critical payment-path integrations. At p99, a single slow request in a hundred can blow the budget, so alerting on p99 requires careful tuning to avoid noise.
Accounting for regional variance

A single global latency SLO can mask severe regional problems. A request from us-east-1 to an OpenAI endpoint hosted in the US might complete TTFT in 400 ms, while the same request from ap-southeast-1 takes 900 ms. If you average them, you get a comfortable 650 ms that hides the fact that half your Asian users are having a poor experience.
Regional SLO checklist
Use this checklist to decide whether you need per-region SLOs or a single global one:
Your progress is saved automatically in your browser.
Example: two-tier regional SLO
| Region group | Metric | Percentile | Threshold | Window |
|---|---|---|---|---|
| US + EU | TTFT | p95 | 800 ms | 7 days rolling |
| APAC + LATAM | TTFT | p95 | 1 200 ms | 7 days rolling |
Turning your SLO into actionable alerts
An SLO without alerting is a document that lives in Confluence and dies in Confluence. To make it operational, you need two types of alerts:
- Burn-rate alert (fast burn): Fires when the error budget is being consumed at a rate that would exhaust it within hours. This is your pager-level alert. For example, if your 7-day budget allows 0.5 % of requests to exceed threshold, and in the last hour 5 % exceeded it, you are burning at 10× the sustainable rate.
- Burn-rate alert (slow burn): Fires when the budget is being consumed at a rate that would exhaust it within days. This is your ticket-level alert, something to investigate during business hours.
- Baseline drift alert: Fires when the p50 shifts upward by more than a defined percentage compared to the previous week. This catches gradual regressions before they hit the p95 threshold.
Alert configuration template
# Example alert definition (adapt to your alerting system)
slo:
name: "chat-completion-ttft-eu"
metric: ttft
percentile: p95
threshold_ms: 800
window: 7d
budget_fraction: 0.005 # 99.5% of requests within threshold
alerts:
- name: fast-burn
condition: burn_rate > 10x
lookback: 1h
severity: page
- name: slow-burn
condition: burn_rate > 2x
lookback: 24h
severity: ticket
- name: baseline-drift
condition: p50_delta > 15%
lookback: 7d
severity: warning
This YAML is a template, paste it into your runbook and fill in the actual values from your worksheet.
SLO definition worksheet template
Copy this template into your team wiki and fill in each field:
- Service name: _______________
- User journey: _______________
- Latency metric: TTFB / TTFT / Total completion time (circle one)
- Percentile: p50 / p95 / p99 (circle one)
- Threshold (ms): _______________
- Measurement window: 7 days / 14 days / 30 days (circle one)
- Region scope: Global / Per-region (specify regions: _______________)
- Error budget (%): _______________
- Fast-burn alert threshold: _____ × sustainable rate over _____ hours
- Slow-burn alert threshold: _____ × sustainable rate over _____ hours
- Data source: Observinio probes / Internal APM / Both
- Review cadence: Monthly / Quarterly
- SLO owner: _______________
- Escalation path: _______________
Frequently Asked Questions
Start measuring before you start promising
A latency SLO is only as good as the data behind it. If you are setting thresholds based on gut feeling or a single region's numbers, you are building on sand. Observinio gives you daily latency probes from 21 global regions across OpenRouter and OpenAI endpoints, baseline comparisons, and email alerts when things degrade, exactly the inputs this worksheet asks for. Check the status page to see current provider latency, or set up alerts so you know the moment your error budget starts burning.
Error budget calculator
Enter your SLO target and measurement window to see how many requests can breach the threshold before your budget is exhausted.
Additional Resources
- Chapter 2 - Implementing SLOs - A latency SLO can capture this user base by setting multiple thresholds: 90% of requests are faster than 100 ms, and 99% of requests are faster than 400 ms.
- Latency SLOs Done Right - What is an SLO? Service Level Indicator (SLI). A metric that quantifies the quality or reliability of your service. Typically of the form ...
- Service Level Objective Examples - Here is an example excerpt from Section 2 of an “Implement Worksheet” related to the page load time SLO. It defines several ways that statistics relevant to the ...
Monitor AI API latency from 22 regions
Observinio runs daily probes against OpenRouter and OpenAI endpoints and emails you when latency degrades.
Set up alerts