Latency cost calculator spreadsheet
When your LLM API response time creeps from 200 ms to 800 ms, the immediate cost feels invisible. But multiply that delay across thousands of daily requests, layer in user frustration and abandoned sessions, and suddenly you're looking at real business impact. A latency cost calculator spreadsheet transforms vague performance concerns into hard numbers, helping you decide whether to switch providers, add regional endpoints, or invest in caching.


Photo by https://kaboompics.com/ from Pexels
When your LLM API response time creeps from 200 ms to 800 ms, the immediate cost feels invisible. But multiply that delay across thousands of daily requests, layer in user frustration and abandoned sessions, and suddenly you're looking at real business impact. A latency cost calculator spreadsheet transforms vague performance concerns into hard numbers, helping you decide whether to switch providers, add regional endpoints, or invest in caching.
This guide walks you through building a cost model that connects API latency to revenue loss, support overhead, and infrastructure spend. Whether you're comparing OpenRouter latency across regions or evaluating direct OpenAI endpoints, a structured calculator gives you the data to justify engineering decisions.
TL;DR
- Latency costs compound across request volume, user churn, and operational overhead, not just raw milliseconds.
- A three-layer cost model (throughput impact, user retention, operational cost) captures the full picture better than single-metric dashboards.
- Regional latency variance from Observinio's 21 probes reveals provider blind spots that provider dashboards mask.
- Spreadsheet templates save weeks of back-of-envelope math and keep cost assumptions auditable.
- Monthly updates tied to incident data and Observinio degradation alerts keep your model grounded in reality.
Key takeaway: Latency costs extend far beyond raw milliseconds—100 ms of added delay can compound into 1–2% conversion loss, doubled support load, and cascading operational expenses. A structured three-layer cost model (throughput impact, user retention, operational overhead) transforms vague performance concerns into quantifiable business impact, making latency investment decisions data-driven and defensible.
Understanding latency cost: Beyond milliseconds
Most teams track latency as a raw metric, TTFB (time to first byte), TTFT (time to first token), but never connect it to revenue. That gap leaves money on the table. A 500 ms slowdown in a chat completion API doesn't just feel sluggish; it directly impacts:
- User engagement: Studies show that 100 ms of added latency reduces conversion by 1–2% in web services. LLM chat interfaces are even more sensitive because users expect near-synchronous responses.
- Support load: Slow completions trigger repeat requests, retry loops, and support tickets. A 2× latency increase can double complaint volume without fixing the root cause.
- Operational cost: Regional failover, load balancing, and monitoring all multiply when latency variance forces you to route around slow endpoints.
"Later I'll show some various market scenarios that you can use as a guide but for now let's assume a one-month delay will cause a 10% loss the first year.">, Cost of Delay: How to Calculate It
This principle applies directly to API latency. Every month your users experience degraded latency is a month of compounding churn and missed revenue.
Building your three-layer cost model

A complete latency cost model rests on three interconnected layers. Each layer feeds into the next, creating a cascade of cost impact that a single metric dashboard would miss.
Layer 1: Throughput and token cost impact
This is the simplest layer but easy to underestimate. When API latency increases, three things happen:
- Token per request falls: Users abandon multi-turn conversations or ask simpler questions to avoid waiting.
- Request concurrency drops: Your inference pipeline handles fewer simultaneous requests because each request holds a connection longer.
- Provider costs scale non-linearly: If latency forces you to switch to a higher-tier provider (e.g., from OpenRouter batch pricing to direct OpenAI), per-token cost jumps 20–40%.
Layer 2: User retention and churn
This layer has the largest long-term impact. Slow APIs erode trust and drive churn.
Research from Amazon and Google shows that latency elasticity (the rate at which latency increase drives user drop-off) varies by use case, but 100 ms of added latency typically causes 0.5–1.5% churn. For a SaaS platform with 10,000 paying users, that's 50–150 lost users per 100 ms of degradation. At $50 ARPU per month, that's $30,000–$90,000 in monthly revenue at risk.
Churn compounds over time. Losing 100 users one month means losing their annual value (if monthly churn is abnormally triggered by an incident) or a permanent cohort loss (if the slowdown persists). A latency incident that persists for two weeks can create a 3–5% permanent retention hit that lasts for months.
Layer 3: Operational overhead and incident cost
Every latency incident creates operational debt:
- On-call response time: Alert fatigue from regional latency spikes can add 5–10 hours of engineering time per week during high-variance periods.
- Failover and rerouting: Manual or automated failover to backup endpoints increases infrastructure cost by 10–30% during incident windows.
- Customer escalation and credit: Users who experience slowdowns often request credits. A single high-profile support escalation can cost $500–$5,000 in time and goodwill.
Structuring the spreadsheet: Step-by-step setup

Step 1: Define your baseline and scenarios
Create a worksheet with these columns:
| Metric | Baseline (Current) | Scenario A (Provider X) | Scenario B (Caching) | Scenario C (Regional) |
|---|---|---|---|---|
| P50 Latency (ms) | 250 | 180 | 220 | 200 |
| P95 Latency (ms) | 450 | 320 | 400 | 350 |
| Daily Requests | 100,000 | 100,000 | 100,000 | 100,000 |
| Avg Tokens/Request | 150 | 150 | 152 | 151 |
| Cost per Token | $0.0005 | $0.0003 | $0.0005 | $0.0005 |
Step 2: Calculate throughput impact
Create a derived section:
| Cost Layer | Formula | Baseline | Scenario A |
|---|---|---|---|
| Monthly Tokens | Daily Requests × Avg Tokens × 30 | 450M | 450M |
| Monthly Token Cost | Monthly Tokens × Cost per Token | $2,250 | $1,350 |
| Estimated Churn from Latency | P95 Latency × 0.01 | 0.45% | 0.32% |
| Users Churned | 10,000 × Estimated Churn | 45 | 32 |
| Revenue Impact from Churn | Users Churned × $50 ARPU | $2,250 | $1,600 |
Step 3: Add operational overhead
Layer in incident cost:
| Item | Baseline | Scenario A |
|---|---|---|
| Latency Variance (Std Dev) | 120 ms | 85 ms |
| Estimated Incident Hours/Month | 8 | 3 |
| Engineer Hours @ $150/hr | 1,200 | 450 |
| Failover/Reroute Cost | $500 | $150 |
| Customer Credits (est.) | $1,000 | $300 |
| Total Operational Cost | $2,700 | $900 |
Step 4: Calculate net benefit
Sum all cost layers:
| Layer | Baseline | Scenario A | Monthly Saving |
|---|---|---|---|
| Token Cost | $2,250 | $1,350 | $900 |
| Churn / Retention Loss | $2,250 | $1,600 | $650 |
| Operational Overhead | $2,700 | $900 | $1,800 |
| Total Monthly Cost | $7,200 | $3,850 | $3,350 |
| Annual Savings | – | – | $40,200 |
Practical checklist: Building your first calculator
Your progress is saved automatically in your browser.
Connecting to real data: Observinio integration

The most effective latency cost calculator is one tied to live monitoring data. Observinio's regional probes make this feasible:
- Daily probes from 21 regions capture real-world TTFB and token latency, not provider averages.
- Degradation alerts flag when latency crosses thresholds. Link these alerts directly to your cost calculator to quantify the impact of each incident.
- Weekly summaries show latency trends by provider and region, helping you spot emerging problems before they cascade into churn.
- Monday morning: Observinio email summary arrives with P95 latency by region for the past week.
- Check for incidents: If any region exceeded your SLO latency, note the hours affected and which provider was slow.
- Update calculator: Plug incident hours into the operational overhead row; recalculate monthly impact.
- Share with stakeholders: A one-slide summary ("Latency incidents this week cost us approximately $X in churn and overhead") keeps leadership aligned on investment priorities.
Common pitfalls and how to avoid them
Pitfall 1: Ignoring P95 latency, only tracking P50
P50 (median) hides tail latency. Your users experience P95 and P99 latencies most acutely. Always include P95 in your cost model. Observinio's regional probes report percentiles, not just averages.
Pitfall 2: Assuming churn is uniform across all users
Enterprise users tolerate latency better than casual users. Segment your user base and assign different churn factors. A single blended churn factor underestimates premium user loss.
Pitfall 3: Forgetting that latency variance causes cascading costs
High variance (std dev = 200 ms) causes more support load than consistently high latency (mean = 400 ms, std dev = 20 ms) because users cannot adapt their behavior. Variance adds operational cost beyond the raw latency number.
Pitfall 4: Not updating the calculator after major incidents
A production incident that lasted 30 minutes might reveal $15,000 in unexpected churn. Use that data to recalibrate your churn factor; do not ignore it.
Pitfall 5: Conflating provider latency with your application latency
Your total response time = provider latency + network + your stack. Isolate provider latency using Observinio's direct probes. If your P95 is 600 ms but provider latency (from Observinio) is 350 ms, your stack adds 250 ms. Optimizing your stack may yield better ROI than switching providers.
FAQ
Frequently Asked Questions
Next steps: Make latency visible and actionable
A latency cost calculator spreadsheet is only valuable if it drives decisions. Once you build it, integrate it into your regular business reviews. Share one monthly chart with leadership: "Latency incidents this month cost approximately $X in churn and operational overhead. Switching to Provider Y would reduce this by $X annually."
Observinio's daily probes and degradation alerts provide the real-world data to keep your calculator grounded. By tying regional latency variance to business impact, you move latency from a technical metric to a revenue metric, and engineering investments suddenly become easy to justify.
Start with a simple three-layer model (token cost, churn, operations). Add sophistication only as you collect more incident data. Your first calculator does not need to be perfect; it just needs to be defensible and tied to real production metrics.
Building your first calculator: Visual workflow
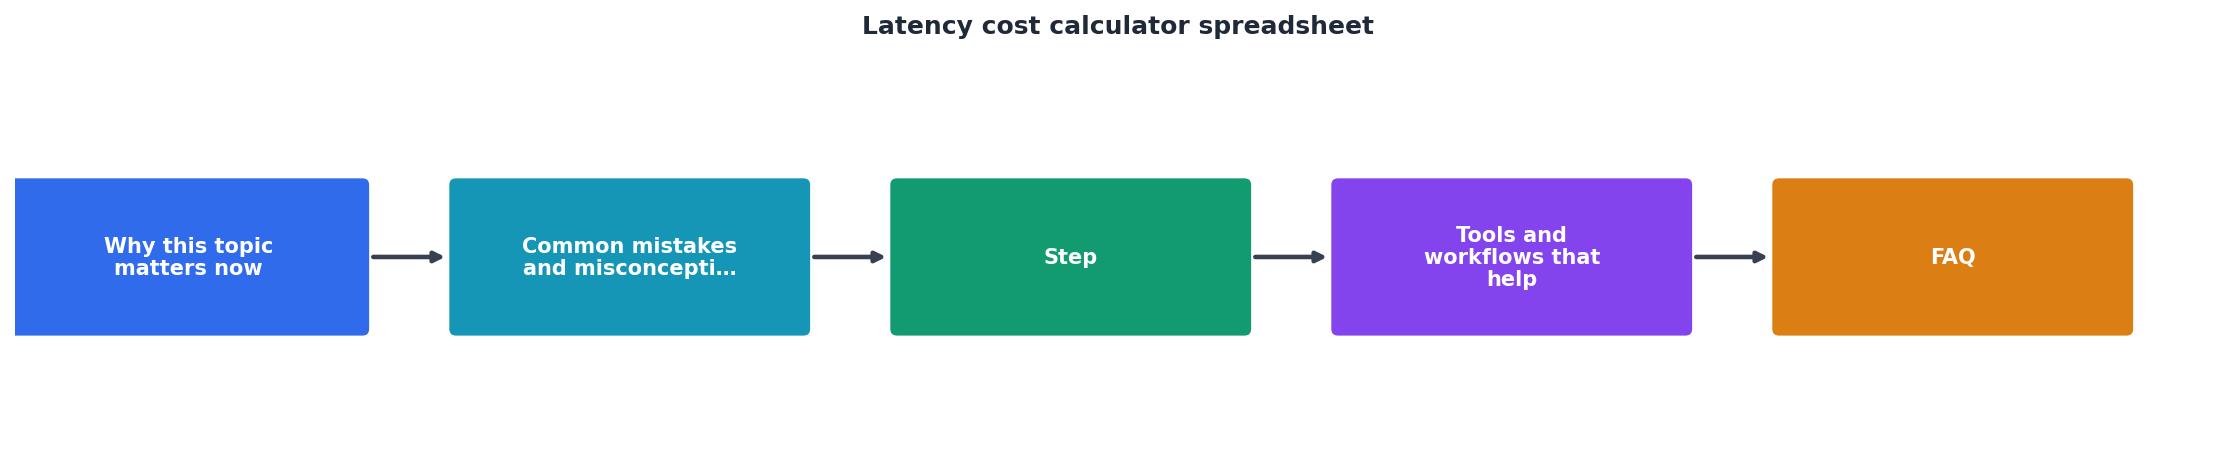
Latency Cost Calculator Implementation Timeline
Total time investment: 40–60 hours. Expected ROI on decision-making clarity: 10:1 within six months of using the model to guide infrastructure and provider choices.
Additional Resources
- Cost of Delay: How to Calculate It - Free Excel spreadsheet - How to calculate cost of delay and download a free excel spreadsheet to get you started on your way. This step-by-step guide explains why cost of delay matters and how to apply it to your business decisions.
- How to Create Cost of Delay Calculator in Excel (with Easy Steps) - This article demonstrates how to create a cost of delay calculator in Excel with practical examples and formulas you can adapt for latency analysis.
- Cost Of Delay Template Download - Excel cost of delay template that provides a structured foundation for modeling financial impact of delays and slowdowns across your business operations.
Monitor AI API latency from 22 regions
Observinio runs daily probes against OpenRouter and OpenAI endpoints and emails you when latency degrades.
Set up alerts