Incident postmortem template (LLM outage)
When an LLM API outage hits your production system at 2 a.m., the immediate priority is clear: restore service and get customers writing again. But the work doesn't end when latency returns to baseline. A structured incident postmortem, conducted within 48 hours of resolution, transforms chaos into documented learning and prevents repeat failures. This resource provides a battle-tested postmortem template, real-world examples tied to LLM provider outages, and a step-by-step workflow for SREs and platform engineers managing AI API reliability.

Photo by cottonbro studio from Pexels
When an LLM API outage hits your production system at 2 a.m., the immediate priority is clear: restore service and get customers writing again. But the work doesn't end when latency returns to baseline. A structured incident postmortem, conducted within 48 hours of resolution, transforms chaos into documented learning and prevents repeat failures. This resource provides a battle-tested postmortem template, real-world examples tied to LLM provider outages, and a step-by-step workflow for SREs and platform engineers managing AI API reliability.
TL;DR
- Postmortems should happen within 48 hours of resolution; blameless culture accelerates root cause discovery and team buy-in.
- Document timeline, impact (latency increase, error rate, user count affected), root cause, and exactly three to five corrective actions with owners and deadlines.
- Regional latency variance (e.g., OpenRouter slower in APAC but fast in US) often masks provider issues, use multi-region probe data to surface the real picture.
- Publish a lightweight summary (internally or publicly) so future on-call engineers and the product team learn from every incident.
- Weekly latency trend reports and degradation alerts narrow the gap between incident and investigation, reducing MTTR and postmortem cycle time.
Why postmortems matter for LLM services

When your chat product goes dark because OpenAI's token-per-minute rate limit spikes or OpenRouter's inference pool degrades, your team enters crisis mode. Incident response is reactive: triage the issue, page the on-call, rollback or failover to a secondary provider. Response typically takes 15–45 minutes depending on alerting speed and team familiarity with the incident space.
But once service is restored, most teams move on. They log a ticket, close Slack, and resume normal work. This is exactly where learning dies and patterns repeat.
A postmortem flips that script. Instead of treating each outage as a one-off disaster, you capture:
- Timeline: When did latency spike? When did the first alert fire? When did on-call page? How long until the team diagnosed the cause?
- Impact metrics: How many users were affected? What was the TTFB (time to first byte) increase? Did error rate climb? What revenue impact, if any?
- Root cause: Was it a provider issue (OpenAI token limits, OpenRouter routing lag), your own routing logic (bad failover rules), or regional variance (US fast, EU degraded)?
- Corrective actions: What three to five changes prevent this exact scenario next time, and who owns them?
"Most vendors will tell you ITSM implementation takes six months to a year, but modern, configuration-first platforms have rewritten the math entirely.">, [How to Write Incident Postmortems [Free Postmortem Template+Demo]](https://www.xurrent.com/blog/how-to-write-incident-postmortem)
For LLM platforms in particular, postmortems prevent two classes of repeat failures:
- Provider-side degradation. If OpenRouter's inference pool saturates in Singapore and your multi-region probes don't catch it, your customers in APAC hit timeouts. A postmortem surfaces the need for dedicated probes in that region.
- Your own routing bugs. Bad logic for switching between GPT-4 and GPT-3.5-turbo, or a cache invalidation bug that causes thundering herd, will repeat monthly until a postmortem forces a code review.
Anatomy of a postmortem: the template

A strong postmortem lives in a shared document (Google Doc, Confluence, or GitHub Wiki) and follows this structure:
1. Executive summary (2–3 sentences)
Your progress is saved automatically in your browser.
Brief headline of what happened, when, and impact. Example:
OpenAI API latency degradation in us-east-1 on 2025-02-15 from 14:22 to 15:04 UTC. TTFB increased from 180ms to 820ms. Approximately 3,200 concurrent chat users experienced timeouts. No data loss.
2. Timeline (minute-level precision)
List every important moment in chronological order:
- 14:20 UTC: OpenAI reports planned maintenance on status page (not visible to API consumers).
- 14:22 UTC: First latency spike detected in us-east-1 (Observinio daily probes show 400ms → 750ms TTFB in 2 minutes).
- 14:25 UTC: On-call receives automated alert for "TTFB > 600ms in US region."
- 14:28 UTC: On-call pages platform engineer and checks Observinio status page; confirms spike is isolated to OpenAI direct endpoint, OpenRouter unaffected.
- 14:35 UTC: Platform engineer deploys failover rule to route all new completions to OpenRouter (existing requests drain from OpenAI).
- 14:38 UTC: Latency returns to baseline (180ms).
- 15:04 UTC: OpenAI resolves maintenance and returns to normal; team flips routing back to primary.
3. Impact quantification
Be specific about what broke and for how long:
- Duration: 42 minutes (14:22–15:04 UTC).
- Affected regions: us-east-1 only (us-west-2, eu-west-1 unaffected).
- Error rate: 0% (no errors; requests completed but slow).
- User impact: ~3,200 concurrent users; average response time 820ms (vs 180ms baseline). Estimated 45 chat submissions queued or abandoned.
- Revenue impact: Minimal (no churn detected in post-incident metrics).
4. Root cause
Isolate the cause, not just symptoms. For LLM outages, drill into:
- Was it the provider (check their status page, Twitter/X, or postmortem)?
- Was it regional (check latency by region in Observinio)?
- Was it your routing or failover logic?
- Was it client-side (rate limiting, token bucket misconfiguration)?
5. Corrective actions (3–5, with owners and deadlines)
List concrete changes, not vague aspirations. Each action should answer: "Who does it? By when? How do we measure success?"
Example corrective actions:
| Action | Owner | Deadline | Success Metric |
|---|---|---|---|
| Implement exponential backoff retry logic with jitter for rate-limit 429 responses | Platform Eng (Sarah) | 2025-02-22 | Unit tests pass; no 429s in staging under load test. |
| Add dedicated Observinio probes for us-east-1 (currently only aggregate US region coverage) | SRE (Marcus) | 2025-02-20 | 6 probes in us-east-1; alerting fires within 90 seconds of latency spike. |
| Document OpenRouter as official secondary provider; update runbook with failover procedure | DevOps (Jamie) | 2025-02-18 | Runbook approved by on-call; one dry run completed. |
| Review OpenAI status page subscription; add webhook to Slack #alerts channel for planned maintenance | SRE (Marcus) | 2025-02-19 | Webhook tested; next maintenance event routed to Slack. |
6. What went well
Celebrate the team. This wasn't a failure; it was a win.
- Observinio alerts fired within 3 minutes, giving the team early visibility.
- Failover to OpenRouter was executed cleanly with zero failed requests.
- Communication to customers was timely (status page update posted at 14:28 UTC).
7. What we'll do differently
Framing improvements as learning, not blame, keeps the team engaged and honest.
- Next time, we'll check the provider status page at minute 1 of any latency anomaly, not minute 10. (Process change, no code needed.)
- We need true regional SLOs in Observinio, not just aggregate US latency. (Product/ops change.)
- Our retry logic assumes transient failures; we didn't account for sustained provider degradation. (Code review and redesign.)

Step-by-step: running a postmortem meeting
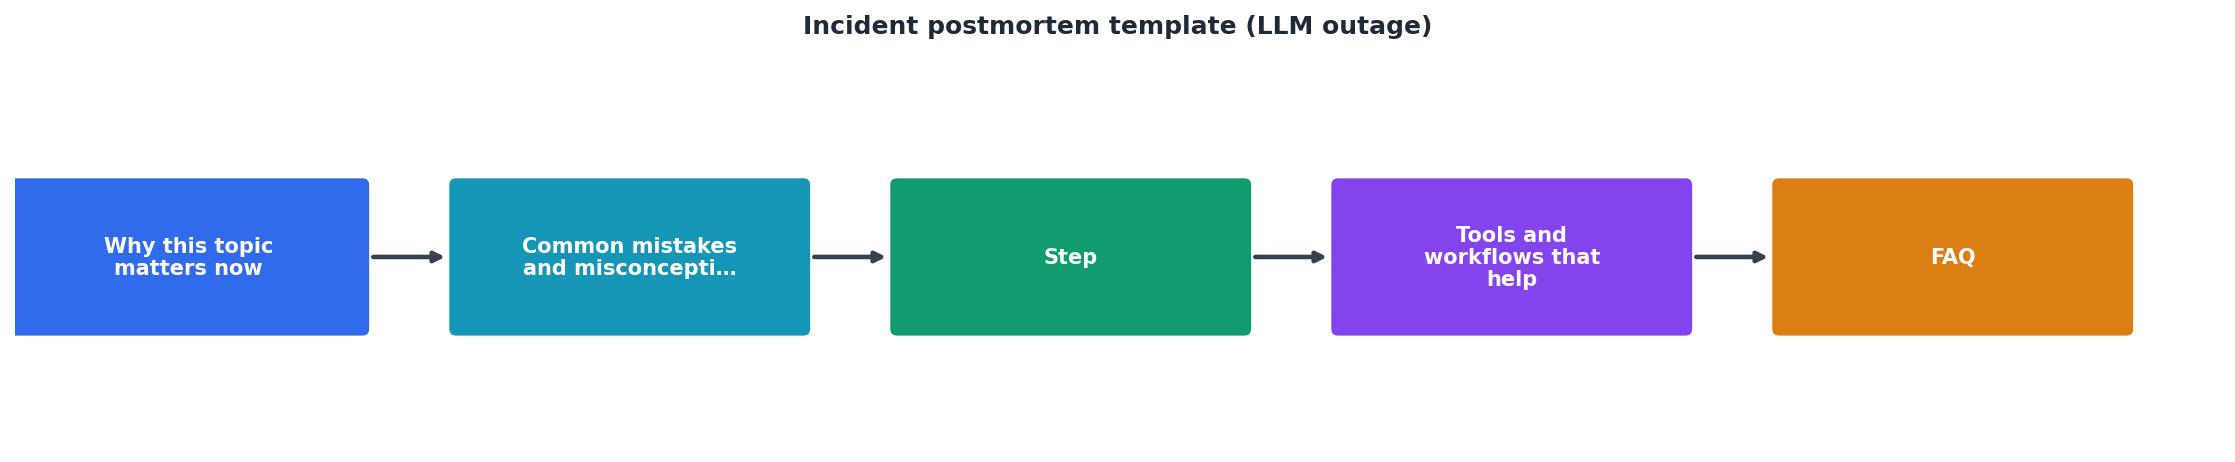
Schedule within 48 hours
The sooner after resolution, the fresher the details and the higher engagement. Aim for 24 hours for high-impact incidents (customer-facing downtime) or 48 hours for lower-severity (latency spike, no errors).
Assign a facilitator (not the on-call responder)
The person who fought the fire shouldn't also moderate the discussion. Pick a peer, another SRE, platform engineer, or manager, to keep the meeting blameless and forward-looking.
Gather data beforehand
Pull timelines, logs, and latency metrics from Observinio, CloudWatch, or your APM. Share this as a pre-read 24 hours before the meeting so participants come prepared.
Run the meeting (60–90 minutes)
- Recap timeline (10 min): Facilitator walks through the documented sequence. No additions yet.
- Q&A on timeline (10 min): Participants ask clarifying questions; add missing events.
- Discuss root cause (15 min): What was the trigger? Was it foreseeable?
- Brainstorm corrective actions (20 min): Open discussion; no filtering. Capture all ideas.
- Prioritize and assign (15 min): Rank actions by impact and effort; assign owners and deadlines.
- Publish and commit (5 min): Confirm the doc goes into your wiki/archive; owners acknowledge their action items.
Publish and track
Post a summary (even one paragraph) to your team Slack, weekly newsletter, or status page. Include the link to the full postmortem. Track corrective actions in your sprint or project management system; review progress at the next all-hands or weekly ops sync.
Real-world example: multi-region latency variance
A common LLM outage pattern: one region degrades while others stay fast. Here's how a postmortem uncovers it:
Incident: "Chat API slow" reports spike at 11:15 a.m. UTC.
Timeline (partial):- 11:15 UTC: Support tickets mention slow responses from Europe.
- 11:18 UTC: On-call checks Datadog; aggregate US latency is 160ms, EU is 850ms.
- 11:22 UTC: On-call checks Observinio dashboard; confirms OpenRouter latency in eu-west-1 is 780ms (vs 150ms baseline), but US is normal.
- 11:25 UTC: Check OpenRouter status page, no maintenance announced.
- 11:30 UTC: Post to OpenRouter Slack support; they confirm a routing issue in their EU inference pool, now fixed.
Corrective action: Add alerting threshold for regional latency variance. If any single region deviates >200ms from its baseline, page on-call. This catches provider-side regional issues before they multiply across support tickets.
FAQ
Frequently Asked Questions
Closing: from incident to insight
An LLM outage is never a failure, it's a test of your observability and response processes. The postmortem is how you turn that test into a lesson. With a structured template, blameless culture, and regional latency data from tools like Observinio, you'll find root causes faster, fix systemic issues, and sleep better knowing your team is learning from every incident.
Start with the template above. Fill in a postmortem within 48 hours of your next incident. Assign actions with real owners and deadlines. Track them to completion. Over six months, you'll notice fewer repeat incidents, faster MTTR, and a team that doesn't fear outages, they anticipate them.
Ready to implement blameless postmortems?
Use the template and checklist above to run your first structured postmortem. Download the template, share it with your team, and schedule the meeting within 48 hours of your next incident. Most teams see measurable MTTR improvements within three postmortem cycles.
For help setting up multi-region latency monitoring and degradation alerts, visit Observinio's status page or contact us to discuss probe placement and alert thresholds for your LLM API stack.
Additional Resources
- How to Write Incident Postmortems [Free ... - Start with a clear and concise title that reflects the incident, for example, "Postmortem: Service Outage on [Date]." Begin the postmortem with an introduction ...
- A collection of postmortem templates - This is a collection of postmortem templates derived from various sources such as the Site Reliability Engineering book, The Practice of Cloud System ...
- A Guide to the Incident Postmortem Process - In this tutorial, we'll show you how to use incident templates to communicate effectively during outages. Adaptable to many types of service interruption.
Monitor AI API latency from 22 regions
Observinio runs daily probes against OpenRouter and OpenAI endpoints and emails you when latency degrades.
Set up alerts