Degradation alert threshold calculator
Setting a degradation alert threshold is one of those tasks that sounds trivial until you actually sit down to do it. Set the bar too tight and your on-call engineer drowns in false positives every night. Set it too loose and real slowdowns reach your users before anyone on the team even opens a terminal. This guide walks you through the math, the practical trade-offs, and a step-by-step calculator you can adapt to your own AI API latency monitoring setup.

Photo by cottonbro studio from Pexels
Setting a degradation alert threshold is one of those tasks that sounds trivial until you actually sit down to do it. Set the bar too tight and your on-call engineer drowns in false positives every night. Set it too loose and real slowdowns reach your users before anyone on the team even opens a terminal. This guide walks you through the math, the practical trade-offs, and a step-by-step calculator you can adapt to your own AI API latency monitoring setup.
TL;DR
- A degradation threshold defines how much latency increase over baseline triggers an alert.
- The right threshold depends on your baseline distribution, regional variance, and acceptable false-positive rate.
- A simple calculator uses baseline median, standard deviation, and a multiplier (typically 1.5×–3× sigma) to produce a concrete millisecond value.
- You should recalculate thresholds whenever your baseline shifts, after provider model updates, routing changes, or seasonal traffic patterns.
- Observinio's daily probes across 21 regions give you the raw data to feed directly into this calculator.
median + (k × σ) that must be recalculated at least every 30 days or after any provider change to stay accurate.Why static thresholds fail for AI APIs

Traditional uptime monitors check a single endpoint from one or two locations and fire when response time exceeds a hard-coded number, say, 2 000 ms. That approach breaks down for LLM inference APIs for three reasons:
- Regional variance is enormous. A request to an OpenAI completion endpoint from
us-east-1might return a Time-to-First-Byte (TTFB) of 180 ms, while the same request fromap-southeast-1regularly takes 420 ms. A single static threshold either ignores the slower region or cries wolf in the faster one. - Baselines drift. Providers update models, change routing, and scale infrastructure. The median TTFT (Time-to-First-Token) you measured last month may no longer be representative. A threshold anchored to stale data produces misleading alerts.
- Tail latency matters more than averages. A p50 of 200 ms with a p99 of 1 800 ms tells a very different story than a p50 of 300 ms with a p99 of 450 ms. Your threshold calculator must account for the shape of the distribution, not just the center.
Inputs you need before calculating
Before you plug numbers into any formula, gather the following data points for each region-endpoint pair you want to monitor:
- Baseline median (p50): The middle value of your latency sample over the last 7–14 days.
- Baseline p95 or p99: The tail value that captures outlier behavior without being dominated by one-off spikes.
- Standard deviation (σ): Measures how spread out your latency values are around the median.
- Sample size (n): The number of probe measurements in your baseline window. More samples yield a more stable threshold.
- Acceptable false-positive rate: How many spurious alerts per week your team can tolerate. A common target is fewer than two false alerts per week per region.
eu-west-1, and compute the statistics above.
The threshold formula step by step
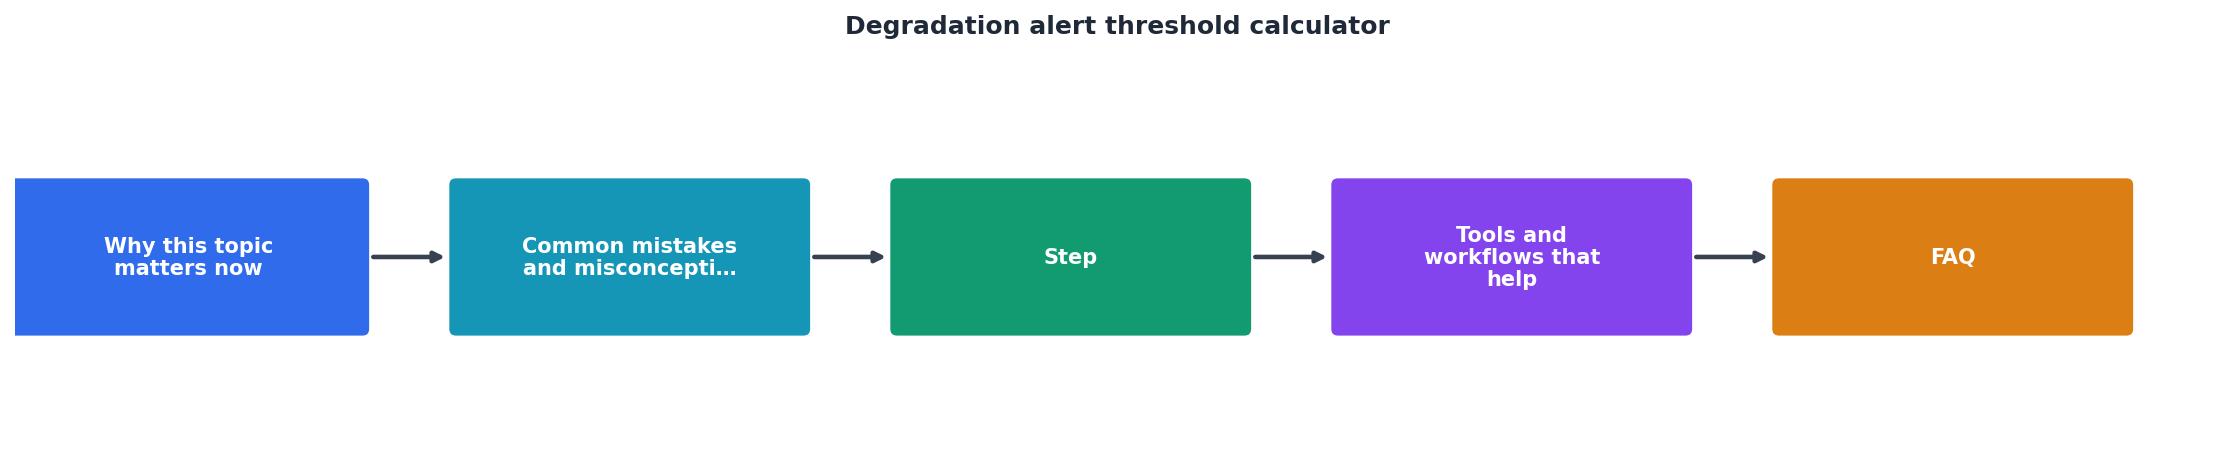
Here is the core calculation, broken into discrete steps so you can implement it in a spreadsheet, a Python script, or even a quick shell one-liner.
Step 1: Collect baseline samples
Pull the last 7–14 days of TTFB or TTFT measurements for a single region-endpoint pair. Aim for at least 50 data points; 100+ is better. Remove any measurements taken during known outages, you want the baseline to represent normal operating conditions.
Step 2: Compute descriptive statistics
Calculate the following from your cleaned dataset:
- Median (p50): Sort the values and take the middle one.
- Standard deviation (σ): Use the population standard deviation if you have the full probe history, or the sample standard deviation if you are working with a subset.
- p95: The value below which 95 % of measurements fall.
Step 3: Choose a sensitivity multiplier (k)
The multiplier k controls how many standard deviations above the median a measurement must be before it counts as degraded. Common choices:
| Multiplier (k) | Sensitivity | Typical use case |
|---|---|---|
| 1.5 | High | User-facing chat with strict SLOs |
| 2.0 | Medium | General production APIs |
| 3.0 | Low | Batch or async workloads |
k means fewer alerts but slower detection. Start with k = 2.0 and adjust after one week of observation.
Step 4: Calculate the threshold
threshold_ms = median + (k × σ)
For example, if your baseline median TTFB from eu-central-1 to OpenRouter is 210 ms with σ = 45 ms, and you choose k = 2.0:
threshold_ms = 210 + (2.0 × 45) = 300 ms
Any probe returning a TTFB above 300 ms from that region would be flagged as degraded.
Step 5: Add a consecutive-breach rule
A single measurement above the threshold can be noise. Require N consecutive breaches (typically 2–3) before firing an alert. This dramatically reduces false positives without meaningfully delaying detection. With Observinio's daily probes, two consecutive breaches means you are alerted within 48 hours of a sustained regression, fast enough for most SLO windows.
"These calculators assume your statistical settings are set at a significance threshold of 0.05 and a power threshold of 80%.">, Monitoring window
Step 6: Validate with historical data
Replay your threshold against the last 30 days of probe data. Count how many alerts it would have generated. If the number exceeds your false-positive budget, increase k by 0.5 and re-run. If it catches zero events during a period where you know latency was elevated, decrease k.
Practical calculator checklist
Use this checklist every time you set up or recalibrate a degradation alert:
Your progress is saved automatically in your browser.
Handling multi-region deployments
When you serve users from multiple continents, a single global threshold is almost useless. Instead, compute a separate threshold for every region you care about. Observinio probes from 21 regions, which means you can generate 21 independent thresholds for each provider endpoint.
A practical approach:
- Group regions by latency tier. For example, US-East and US-West may share a similar baseline to OpenAI's US-hosted models, while Asia-Pacific and South America will have higher baselines.
- Apply the same
kacross tiers for consistency, but let the median and σ differ. - Alert per region, not globally. A degradation in
ap-northeast-1should not be masked by healthy probes inus-east-1. Per-region alerts let you pinpoint whether the issue is provider-side routing, submarine cable congestion, or a regional capacity problem.
When to recalculate your thresholds

Thresholds are not set-and-forget. Recalculate when:
- A provider ships a new model version. Model updates frequently change inference latency. A new checkpoint for
gpt-4oor a Mixtral variant on OpenRouter can shift your baseline by tens of milliseconds. - You change routing or proxy layers. Adding a caching proxy, switching from OpenRouter to a direct endpoint, or enabling streaming all alter the latency profile.
- Seasonal traffic patterns emerge. Some providers show higher latency during US business hours. If your baseline was collected over a weekend, it may underestimate weekday latency.
- Your false-positive rate drifts. If your team starts ignoring alerts, the threshold is too tight. If users report slowness before alerts fire, it is too loose. Review alert logs monthly.
Key takeaway: A degradation threshold is not a single magic number — it is a per-region, per-endpoint value derived from median + (k × σ) that must be recalculated at least every 30 days or after any provider change to stay accurate.
Quick threshold calculator
Threshold: 300.0 ms
Sample Python implementation
Below is a minimal Python snippet you can drop into a notebook or a CI job to compute thresholds from a list of latency samples:
import statistics

def calculate_threshold(samples: list[float], k: float = 2.0) -> float:
    """Return degradation threshold in ms."""
    median = statistics.median(samples)
    stdev = statistics.pstdev(samples)
    return round(median + k  stdev, 1)

samples = [
    198, 210, 205, 215, 220, 195, 230, 210, 200, 245,
    208, 212, 199, 225, 218, 202, 211, 207, 235, 222,
    201, 209, 214, 206, 219, 228, 203, 217, 213, 221,
]

threshold = calculate_threshold(samples, k=2.0)
print(f"Median: {statistics.median(samples)} ms")
print(f"Std dev: {round(statistics.pstdev(samples), 1)} ms")
print(f"Threshold (k=2.0): {threshold} ms")
Running this with the sample data above produces a threshold around 224 ms, any probe above that value counts as a breach.
Frequently Asked Questions
k = 2.0 for general production workloads. If you are running a latency-sensitive, user-facing chat feature with a strict SLO (e.g., p95 TTFT under 500 ms), drop to k = 1.5. For batch or asynchronous inference jobs where a few hundred extra milliseconds are acceptable, use k = 3.0. After one week, review the number of alerts generated and adjust up or down by 0.5 increments.k. If the new baseline is substantially higher, you may also need to revisit your SLO targets and communicate the change to stakeholders.Start monitoring with real data
Calculating thresholds on paper is useful, but the numbers are only as good as the probe data feeding them. Observinio runs daily latency probes against OpenRouter and OpenAI endpoints from 21 global regions, computes baselines automatically, and sends you degradation alerts when thresholds are breached. Pair that with the weekly summary email and you have a continuous recalibration loop without building any infrastructure yourself. Check the status page to see current regional latency, or get in touch to set up alerts for the endpoints your team depends on.
Additional Resources
- Monitoring window - The following calculators allow you to see what range of degradations your policy is likely to detect based on your metric characteristics and ...
- How to Create Threshold Alerting - This guide walks through the essential patterns for building threshold alerts that catch real problems without drowning your team in noise.
- Configure Relative and Absolute Alert Thresholds in ... - This post explains how relative and absolute thresholds work in Dynatrace alerting. It provides examples and best practices for setting thresholds to reduce ...
Monitor AI API latency from 22 regions
Observinio runs daily probes against OpenRouter and OpenAI endpoints and emails you when latency degrades.
Set up alerts