Customer-facing AI status page copy template
When your product relies on third-party LLM APIs, your users do not care whether the slowdown originates in your code, in OpenRouter's routing layer, or in a provider's GPU cluster three continents away. They see a spinning cursor and they blame you. A well-written, customer-facing AI status page turns that frustration into trust by giving users the same latency data your on-call team already watches. This resource provides a complete, copy-paste-ready template for every section of that page, from the global header banner to individual incident updates, so you can ship a professional status page in an afternoon instead of a quarter.


Photo by Mikhail Nilov from Pexels
When your product relies on third-party LLM APIs, your users do not care whether the slowdown originates in your code, in OpenRouter's routing layer, or in a provider's GPU cluster three continents away. They see a spinning cursor and they blame you. A well-written, customer-facing AI status page turns that frustration into trust by giving users the same latency data your on-call team already watches. This resource provides a complete, copy-paste-ready template for every section of that page, from the global header banner to individual incident updates, so you can ship a professional status page in an afternoon instead of a quarter.
TL;DR
- A customer-facing status page for AI-powered products must communicate regional latency, not just binary up/down states.
- The template below covers six core sections: global banner, component grid, regional breakdown, incident timeline, scheduled maintenance, and subscription CTA.
- Each section includes ready-to-use copy with placeholders you fill in with your product name, regions, and thresholds.
- Pair the page with automated data from synthetic probes (like Observinio's 21-region checks) so copy stays accurate without manual edits.
- Include an FAQ on the page itself to deflect support tickets about expected latency ranges.
Why AI products need a dedicated status page
Most traditional status pages were designed for binary services: the database is up or the database is down. AI API dependencies break that model. A model endpoint can return 200 OK while delivering time-to-first-token (TTFT) values three times higher than baseline, technically "up" but functionally degraded for any real-time chat feature. Your customers notice the lag long before your uptime monitor fires.
A dedicated AI status page solves three problems at once:
- Reduces support ticket volume. When users can self-serve latency information, they stop opening "is it just me?" tickets. Teams that publish real-time latency data report up to 40 % fewer inbound support contacts during degradation events.
- Builds trust with enterprise buyers. Procurement teams and security reviewers increasingly ask for public status pages during vendor evaluation. Showing regional TTFB and TTFT data signals operational maturity.
- Gives your own team a communication channel. Instead of drafting incident emails from scratch every time, your on-call engineer posts a structured update and the page handles distribution.
Template overview: six sections your page needs
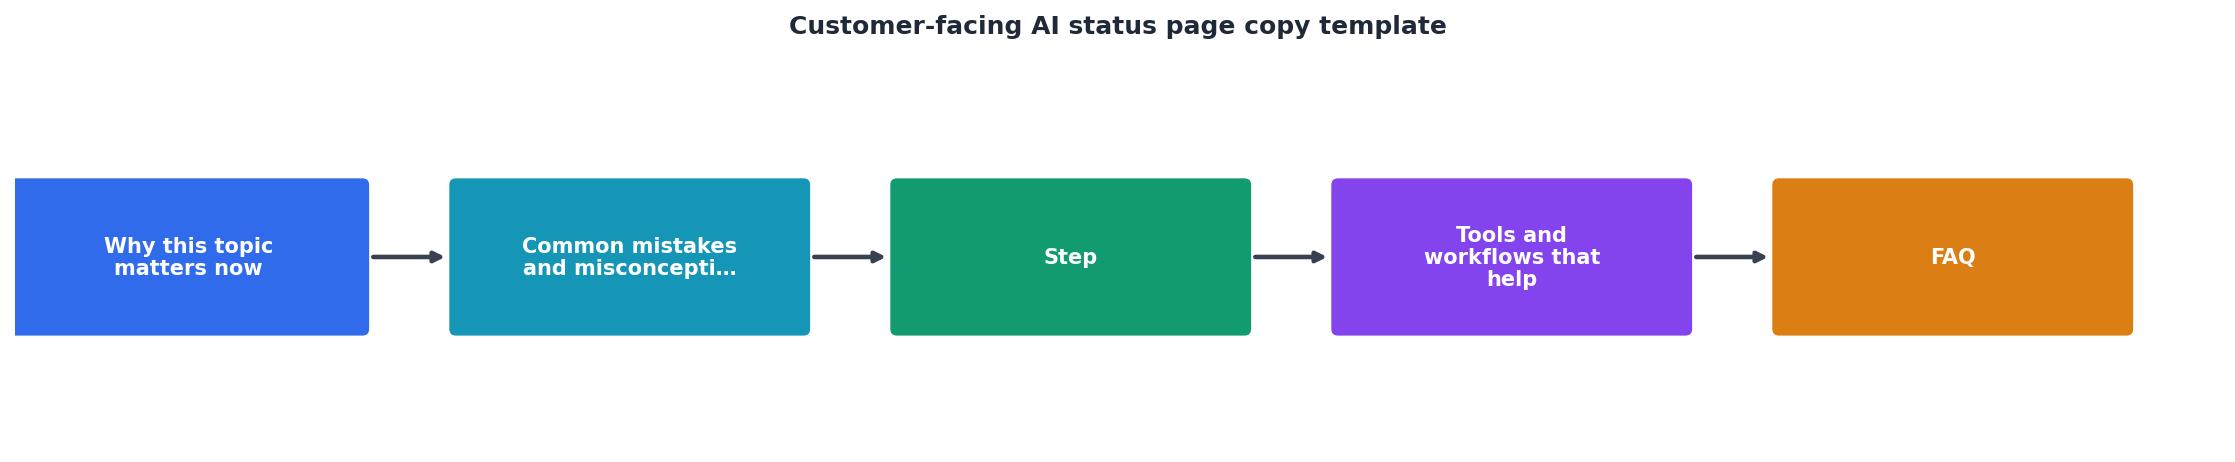
The template is organized into six sections. Each one serves a distinct purpose and audience. Below is a summary before we dive into the actual copy blocks.
| Section | Purpose | Update frequency |
|---|---|---|
| Global banner | Instant visual status (green/yellow/red) | Real-time or every 60 s |
| Component grid | Per-feature or per-model status | Real-time |
| Regional breakdown | Latency by geography | Every 5–15 min |
| Incident timeline | Chronological incident updates | Per event |
| Scheduled maintenance | Advance notice of planned work | As scheduled |
| Subscription CTA | Let users opt in to alerts | Static |
Section 1: Global banner copy
The global banner is the first thing a visitor reads. It must answer one question in under two seconds: "Is the service working right now?"
Ready-to-use copy
All Systems Operational (green state):
All[PRODUCT NAME]AI features are operating normally. Current median TTFT across all regions:[VALUE]ms.
Degraded Performance (yellow state):
We are observing elevated latency on[AFFECTED COMPONENT]. Median TTFT is currently[VALUE]ms, above our[THRESHOLD]ms baseline. Our team is investigating. Last updated:[TIMESTAMP UTC].
Major Outage (red state):
[PRODUCT NAME]is experiencing a service disruption affecting[AFFECTED COMPONENT]. We have identified the issue and are working with our upstream provider to restore normal performance. Next update in[N]minutes.
Keep the banner copy under 40 words for the green state and under 60 words for degraded or outage states. Users scan, they do not read paragraphs here.
Section 2: Component grid copy

List every AI-dependent component your customers interact with. For each component, show a status indicator and a one-line description. Here is a template grid you can adapt:
- Chat Completions API, Operational, Median TTFT:
[VALUE]ms - Embeddings API, Operational, Median latency:
[VALUE]ms - Image Generation, Degraded, Median latency:
[VALUE]ms (above[THRESHOLD]ms baseline) - Fine-tuning Jobs, Operational, Queue wait:
[VALUE]min - Dashboard & Auth, Operational
Naming guidelines
Use names your customers already see in your documentation or SDK. If your internal name for a service is llm-gateway-v2, your status page should still say "Chat Completions API." Consistency with your public API reference reduces confusion.
Section 3: Regional breakdown copy
This is where an AI status page diverges most from a traditional one. LLM API latency varies dramatically by region. A request routed from Frankfurt to a US-East GPU cluster will have a fundamentally different TTFB than one originating in Virginia. Your status page should make this visible.
Template table
| Region | TTFB (p50) | TTFB (p95) | TTFT (p50) | Status |
|---|---|---|---|---|
| US East (Virginia) | [VALUE] ms | [VALUE] ms | [VALUE] ms | Operational |
| US West (Oregon) | [VALUE] ms | [VALUE] ms | [VALUE] ms | Operational |
| Europe (Frankfurt) | [VALUE] ms | [VALUE] ms | [VALUE] ms | Degraded |
| Asia Pacific (Tokyo) | [VALUE] ms | [VALUE] ms | [VALUE] ms | Operational |
| South America (São Paulo) | [VALUE] ms | [VALUE] ms | [VALUE] ms | Operational |
Explanatory copy to place above the table
Regional latency reflects synthetic probe measurements taken every[INTERVAL]minutes from[NUMBER]global locations. Values represent the median (p50) and 95th percentile (p95) over the last[WINDOW]hours. A region is marked "Degraded" when p95 TTFB exceeds[THRESHOLD]ms for more than[DURATION]consecutive minutes.
If you use Observinio, these values can be pulled directly from daily probes across 21 regions, giving you coverage in locations your own infrastructure may not reach. This eliminates the need to maintain your own synthetic probe fleet.
Section 4: Incident timeline copy
Incident updates should follow a strict chronological format. Each entry needs a timestamp, a status label, and a concise description. Here is a step-by-step template for a single incident lifecycle:
- Investigating,
[TIMESTAMP UTC], We are investigating reports of elevated latency on[COMPONENT]in[REGION]. Upstream provider status:[PROVIDER STATUS PAGE LINK]. - Identified,
[TIMESTAMP UTC], The issue has been identified as[ROOT CAUSE SUMMARY]. Our upstream provider ([PROVIDER NAME]) has confirmed the degradation. Estimated resolution:[ETA or "under investigation"]. - Monitoring,
[TIMESTAMP UTC], A fix has been deployed by[PROVIDER NAME]. We are monitoring latency recovery. Current p50 TTFT:[VALUE]ms (baseline:[BASELINE]ms). - Resolved,
[TIMESTAMP UTC], This incident has been resolved. All regions are reporting latency within normal baselines. Total duration:[DURATION]. A postmortem will be published within[N]business days.
"Documentation IndexFetch the complete documentation index at: /llms.txtUse this file to discover all available pages before exploring further.">, Creating a Status Page
Writing tips for incident updates
- Always include UTC timestamps. Your users are global.
- Reference the upstream provider by name when the root cause is external. This is not blame-shifting; it is transparency.
- Quantify recovery: "latency returned to baseline" is vague; "p50 TTFT dropped from 1,400 ms to 320 ms" is useful.
- Link to the provider's own status page when available so power users can cross-reference.
Section 5: Scheduled maintenance copy
Planned maintenance windows deserve their own section so they are not confused with incidents. Use this template:
Scheduled Maintenance,>[DATE][TIME WINDOW UTC]
We will be performing[DESCRIPTION OF WORK]on[COMPONENT]. During this window, users may experience[EXPECTED IMPACT: e.g., "increased latency of up to 500 ms on Chat Completions API" or "brief interruptions to embedding requests"]. No action is required on your part. We will update this page when maintenance is complete.
Keep the expected-impact sentence specific. "Brief interruptions" without a component name forces users to guess whether their workflow is affected.
Section 6: Subscription CTA copy
The final section invites visitors to subscribe to updates so they do not have to manually check the page. Template:
Stay informed. Subscribe to receive status updates via email. We send notifications only for confirmed incidents and scheduled maintenance, no marketing, no spam.>
>[EMAIL INPUT FIELD][SUBSCRIBE BUTTON]
You can also follow real-time updates via our RSS feed at[RSS URL]or integrate with your incident management tool using our webhook at[WEBHOOK DOCS URL].
Implementation checklist
Use this checklist to go from template to live page:
Your progress is saved automatically in your browser.
Common mistakes to avoid
Even with a solid template, teams make recurring errors that undermine the page's value:
- Using only "Operational" and "Major Outage." Add at least a "Degraded Performance" state. Most AI API issues are latency degradations, not full outages. A two-state page will either under-report problems or cry wolf.
- Showing global averages only. A user in Tokyo does not care that the global median TTFB is 180 ms if their regional p95 is 900 ms. Always break down by region.
- Forgetting to close incidents. An open "Investigating" entry from three weeks ago destroys credibility faster than the original incident did. Assign incident closure as a postmortem action item.
- Writing in corporate jargon. "We are experiencing intermittent issues with our inference orchestration layer" means nothing to a developer trying to debug a timeout. Say "Chat Completions API responses in Europe are taking 2–3× longer than normal."
- Manual-only updates. If every status change requires a human to log in and edit text, updates will lag behind reality. Automate the data layer (latency numbers, status colors) and reserve human writing for incident narratives.
Frequently Asked Questions
[LINK])" gives users the cross-reference they need without you owning the accuracy of someone else's reporting.[PROVIDER NAME]. We are monitoring their recovery and will update this page as conditions change." This is transparent without being adversarial. Your users chose your product, not the upstream provider, so they expect communication from you regardless of fault.Key takeaway: A customer-facing AI status page must go beyond binary up/down indicators by surfacing regional latency metrics like TTFB and TTFT at p50 and p95 percentiles, automating data updates from synthetic probes, and providing structured incident timelines so users can self-serve answers instead of filing support tickets.
Keep your status page honest with real data
A beautifully written status page is worthless if the data behind it is stale or manually maintained. The copy template above gives you the words; automated monitoring gives you the numbers. Observinio probes AI API endpoints from 21 global regions every day, compares response times against established baselines, and sends email alerts when degradation is detected. Connecting those alerts to your status page means the "Degraded" banner appears when it should, not 45 minutes later when a customer tweets about it. Explore the Observinio status dashboard or set up alerts to keep your customer-facing page as reliable as the product behind it.
Additional Resources
- Creating a Status Page - To create a new status page: In the Rootly navigation bar, click on Configuration, then Status Pages. Next, click Add New Status Page.
- AI Landing Pages: Copy Templates That Convert - Build high-converting landing pages for AI services with proven copy templates. Headline formulas, benefit stacks, testimonial frameworks, and ...
- Write Sales Page Copy in 5 Minutes with Claude AI - Transform your web design workflow with Claude AI! Learn how to create killer sales pages in minutes, plan user journeys, Proposal templates, ...
Monitor AI API latency from 22 regions
Observinio runs daily probes against OpenRouter and OpenAI endpoints and emails you when latency degrades.
Set up alerts