Cron vs managed probe comparison guide
When you ship LLM features to production, you need to know whether your API calls are fast or slow, before your users complain. The decision between DIY cron jobs and managed probes shapes your entire monitoring strategy. Cron jobs are free and flexible; managed probes are automated, multi-region, and hands-off. This guide compares both approaches with real metrics, cost models, and decision trees so you can pick the right fit for your latency monitoring.

Photo by officialiamrishabh from Pexels
When you ship LLM features to production, you need to know whether your API calls are fast or slow, before your users complain. The decision between DIY cron jobs and managed probes shapes your entire monitoring strategy. Cron jobs are free and flexible; managed probes are automated, multi-region, and hands-off. This guide compares both approaches with real metrics, cost models, and decision trees so you can pick the right fit for your latency monitoring.
TL;DR
- Cron jobs are low-cost and flexible but require you to own infrastructure, parsing, and alerting logic; best for teams with DevOps capacity.
- Managed probes (like Observinio's daily probes from 21 regions) remove operational burden and surface regional latency variance automatically.
- Regional probe placement matters: a single US-based cron job will miss European slowdowns entirely.
- Managed probes scale cost linearly but save engineering weeks; cron scales free but hidden labor costs grow fast.
- For production AI services, managed probes typically pay for themselves through faster MTTR and fewer support tickets.
Key takeaway: Cron jobs are low-cost and flexible but require significant engineering effort for multi-region monitoring. Managed probes eliminate operational burden and reveal regional latency variance automatically, typically paying for themselves within 12 months through faster incident response and fewer support escalations.
When cron jobs make sense
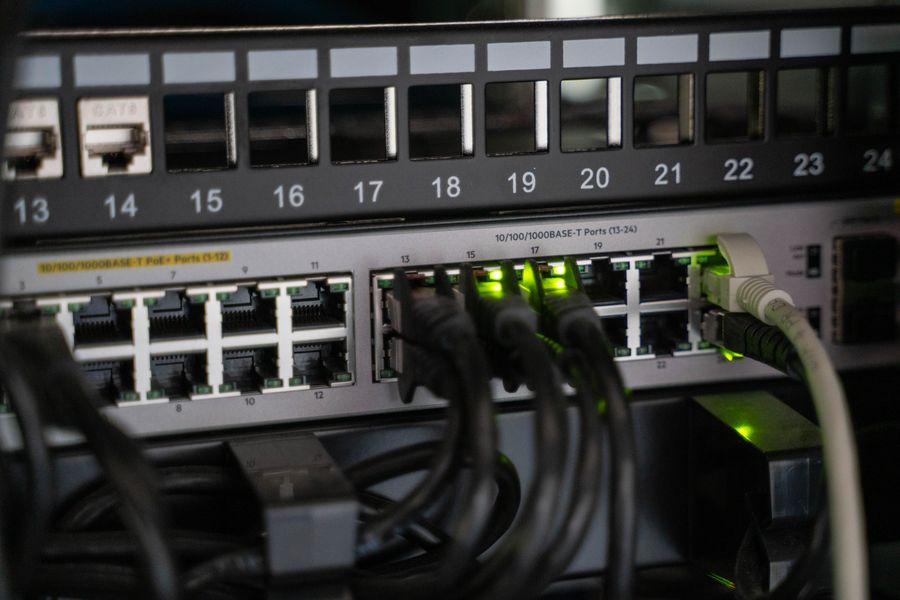
Cron jobs are the traditional approach: you write a script, schedule it with crontab or a task scheduler, and let it run. They work because they're simple and free. Here's when they make practical sense:
- Single-region or domestic-only services. If all your users live in North America and you only care about US latency, a cron job running from a US server is defensible. You won't catch regional variance, but you might not need to.
- High-frequency internal monitoring. If you want to probe every 30 seconds for early warnings to your ops channel, a cron job costs nothing. Managed services typically bill per probe call; cron's incremental cost is zero.
- Non-critical or experimental APIs. Testing a new provider before committing? A cron job is fast to set up and tear down. No contract, no billing surprise.
- Teams with strong DevOps culture. If you already manage a fleet of microservices, cron monitoring fits your existing stack and skills. You own the whole pipeline.
- Latency variance below 200 ms. If your API's tail latency swings by less than 200 ms day-to-day, weekly cron samples might be enough. Higher variance demands tighter sampling.
A minimal cron setup has three parts: a probe script, a results database, and an alerting rule.
# Example: cron job to test OpenAI latency every 5 minutes
/5     /usr/local/bin/probe_openai.sh >> /var/log/probes.log 2>&1
Your probe_openai.sh script measures TTFB (time to first byte) by issuing a real API call and recording the response time:
#!/bin/bash
START=$(date +%s%N)
RESPONSE=$(curl -s -w "\n%{time_total}" https://api.openai.com/v1/chat/completions \
  -H "Authorization: Bearer $OPENAI_KEY" \
  -H "Content-Type: application/json" \
  -d '{"model":"gpt-4o-mini","messages":[{"role":"user","content":"hi"}]}')
END=$(date +%s%N)

TTFB=$((($END - $START) / 1000000))
echo "$(date -u +%Y-%m-%dT%H:%M:%SZ) ttfb_ms=$TTFB" >> /var/log/latency.log
You'd then parse that log, calculate percentiles, and trigger an alert if the 95th percentile crosses your threshold. The hidden cost is the parsing, storage, and alert routing you have to build and maintain.
Why managed probes win for multi-region monitoring
Managed probes are the opposite: you define what to measure, and the provider runs it from a fleet of global locations, parses the data, and alerts you. Observinio, for example, runs probes from 21 regions, US East/West, EU, APAC, and more, without you touching infrastructure.
The multi-region latency problem:
Real-world LLM API latency is not uniform. OpenAI's response time from London can differ from Singapore by 200–400 ms just due to routing and data center distance. A single cron job in us-east-1 will never see that variance. You'll report "our API is fast" to stakeholders, then wonder why your European users complain about timeouts.
Managed probes solve this by design:
- Daily probes from 21 regions reveal whether slowness is global (your problem) or regional (provider or routing issue).
- Automatic baseline comparison shows you whether latency is regressing relative to yesterday or last week.
- Regional degradation alerts notify you the moment one region's latency spikes, before it becomes a support ticket.
If you had only a US-based cron job, you'd see 150 ms average TTFB and assume all is well. A managed probe from Amsterdam would show 320 ms, more than 2x slower, and flag it as a regression.
Operational cost: hidden labor vs. transparent SaaS
On paper, cron jobs are free. In reality, they carry hidden labor costs that compound over time.
Cron cost model:
| Task | Hours | Annual cost @$150/hr |
|---|---|---|
| Initial script + database setup | 12 | $1,800 |
| Alerting logic (e-mail, Slack, PagerDuty) | 8 | $1,200 |
| Parsing & aggregation pipeline | 16 | $2,400 |
| Debugging / fixing failed probes | 20 | $3,000 |
| Adding a new region (manual) | 6 | $900 |
| Storage & infrastructure (small server) | , | $500/year |
| Total, Year 1 | 62 | $9,800 |
| Total, Year 2+ | 25 | $4,250/year (maintenance) |
| Item | Cost |
|---|---|
| Observinio managed probes: daily API latency monitoring, 21 regions, degradation alerts | $200–400/month |
| Setup time (one afternoon) | $100 |
| Total, Year 1 | ~$2,500–5,000 |
| Total, Year 2+ | ~$2,400–4,800/year |
"Most cron job monitoring problems start at design time.">, Our complete cron job guide for 2026
Comparison: cron vs managed probes side by side
| Feature | Cron Job | Managed Probe |
|---|---|---|
| Setup time | 2–4 hours | 15 minutes |
| Regions covered | Usually 1 (yours) | 21+ global regions |
| Latency percentiles (p50, p95, p99) | Manual calculation | Automatic |
| Alerting | Build it yourself | Built-in, multi-channel |
| Regional degradation alerts | Requires custom logic | Native |
| Baseline comparison | Manual analysis | Weekly trend reports |
| Cost (Year 1) | ~$10,000 (labor) | ~$3,000–5,000 |
| Cost (Year 2+) | ~$4,000–6,000 (maintenance) | ~$2,400–4,800 |
| Scaling to 5 regions | 5x the infrastructure + parsing | No extra cost |
| MTTR improvement | 0–2 hours (debug where issue is) | 5–15 minutes (alert shows region) |
Decision tree: how to choose
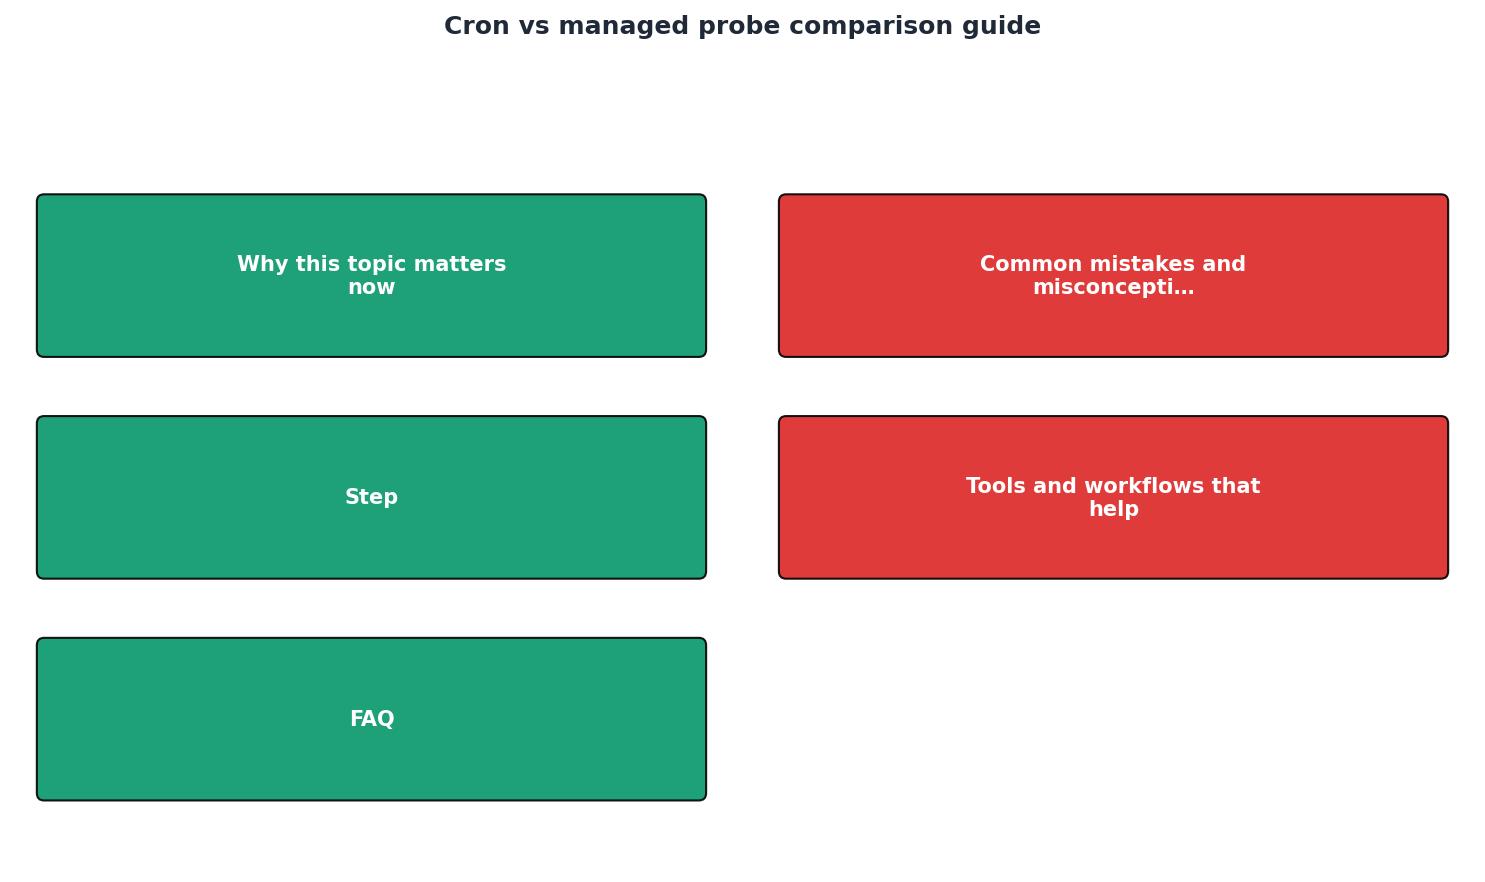
Use this tree to decide which approach fits your situation:
Step 1: How many regions do your users span?Hybrid approach: cron + managed probes
Some teams run both. Here's why it works:
- Cron for internal, high-frequency sampling (every 5 minutes): Catch regressions before they hit users.
- Managed probes for external, multi-region baseline: Track what real users see and compare to provider SLAs.
- Cron alerts your ops channel; managed probes alert leadership and customers.
Getting started: a practical checklist
Your progress is saved automatically in your browser.
FAQ
Frequently Asked Questions
Next steps
If you're running LLM APIs in production and don't have multi-region latency monitoring yet, now is the time to add it. Regional latency variance is invisible until you measure it, and invisible problems become support tickets.
Managed probes remove that blindness. With Observinio's daily probes from 21 regions, degradation alerts, and weekly summaries, you'll catch latency regressions before users do. Start with a baseline comparison against OpenRouter or OpenAI direct to see where your traffic is slowest, then use that data to optimize routing or escalate to your provider. Check Observinio's status page to see real latency trends from the last 7 days, or contact us to set up probes for your own endpoints.
Quick Comparison Summary
Choose cron jobs if: You have a single region, spare DevOps capacity, and latency variance under 200 ms.
Choose managed probes if: You serve multiple regions, need fast incident response (under 15 minutes), or want to detect regional degradation automatically.
Most production AI services benefit from managed probes within the first year through reduced MTTR and eliminated blind spots.
Additional Resources
- Our complete cron job guide for 2026 - What are cron jobs and how do they work? Learn everything you need in our detailed guide and set up your first cron job or monitoring.
- Kubernetes CronJobs Guide: Use Cases & Best Practices - Discover how Kubernetes CronJobs work and learn best practices to schedule, manage, and monitor recurring jobs reliably.
- Best Cron Job Monitoring Tools in 2026 [25 Analyzed, Top ... - I analyzed 25 cron job monitoring tools and picked the top 5. Hyperping bundles cron + uptime + on-call + status pages from $24/mo.
Monitor AI API latency from 22 regions
Observinio runs daily probes against OpenRouter and OpenAI endpoints and emails you when latency degrades.
Set up alerts