APAC routing experiment log template
When you route LLM API traffic across Asia-Pacific regions, latency is not a single number, it's a symphony of variables. Every millisecond matters for chat features, and every region behaves differently. If you're running A/B tests on OpenRouter vs. direct OpenAI endpoints, or experimenting with failover logic, you need a structured way to capture what worked, what didn't, and why. This template gives you that structure.

Photo by zhen tang from Pexels
When you route LLM API traffic across Asia-Pacific regions, latency is not a single number, it's a symphony of variables. Every millisecond matters for chat features, and every region behaves differently. If you're running A/B tests on OpenRouter vs. direct OpenAI endpoints, or experimenting with failover logic, you need a structured way to capture what worked, what didn't, and why. This template gives you that structure.
TL;DR
- APAC routing experiments fail silently without baseline capture; log TTFB, TTFT, and regional variance before and after each change.
- A routing experiment log tracks decision rationale, hypothesis, test dates, regional results, and incident flags, essential for repeatable improvements.
- Use daily synthetic probes from Observinio's 21 regions to populate baseline metrics automatically; manual logs become incident postmortems and optimization evidence.
- Share weekly summaries with your platform team to surface regional patterns (e.g., Singapore latency spike, Tokyo failover wins) that drive next iteration.
- Structured logs accelerate postmortems and prevent regressions when new providers or regions enter rotation.
Key takeaway: Without systematic logging of routing experiments, APAC teams chase the same latency issues repeatedly. A structured experiment log paired with automated baseline captures from synthetic probes transforms routing optimization from reactive firefighting into predictable, repeatable improvement cycles that compound across quarters.
Why APAC routing experiments need structured logging
The Asia-Pacific region spans 15+ time zones and dozens of network topologies. A routing change that improves latency in Sydney might degrade performance in Jakarta. Without a consistent log, you'll chase the same issues repeatedly.
Most platform teams log incidents after users complain. Better teams log during experiments. The best teams use automated baseline captures (via synthetic probes from Observinio's Singapore, Tokyo, Mumbai, Sydney, and other APAC nodes) and pair them with a structured experiment template.
"The job_output module copies stdout and stderr to a log file.">, GitHub
The same principle applies to routing experiments: systematically capture what your system did, not just what your dashboards show. A log becomes your institutional memory when a new engineer inherits the routing strategy, or when a customer reports "your API was fast last month."
Core elements of a routing experiment log

A complete routing experiment log captures six critical dimensions:
- Experiment metadata: Unique ID, date, owner, hypothesis, and success criteria.
- Baseline metrics: TTFB (time to first byte) and TTFT (time to first token) before the change, broken down by APAC region.
- Change description: Exact routing logic modified (e.g., "failover from OpenRouter Singapore to OpenAI regional endpoint").
- Test scope: Which regions, which traffic percentage, how long the experiment ran.
- Results: Post-change TTFB/TTFT by region, anomalies detected, and statistical significance.
- Action: Decision (rollout, rollback, or iterate) and date closed.
Setting up baseline captures from 21 global regions

Before you run an experiment, you need a credible baseline. Observinio probes your OpenRouter and OpenAI endpoints daily from 21 regions, including all major APAC hubs. Here's how to use those probes to feed your log:
Step 1: Export weekly baseline reports
Log into Observinio and generate a weekly summary report for your target regions: Singapore (SG), Tokyo (JP), Sydney (AU), Mumbai (IN), Jakarta (ID), and any others handling your APAC traffic. Export TTFB percentiles (p50, p95, p99) for each provider.
Step 2: Record baseline in your log
In the "Baseline metrics" section of your experiment template, paste the p50/p95 latencies for each region for each provider you're testing. This becomes your regression boundary. If post-experiment TTFB p95 exceeds baseline p95 + 20%, flag it as a potential issue.
Step 3: Enable daily degradation alerts
Set Observinio alerts to email your team whenever TTFB crosses your baseline + threshold for a region. During the experiment window, these alerts become your real-time safety net. A spike in Tokyo latency on day 2 of your test tells you immediately whether your routing change caused it or a provider had an incident.
Step 4: Capture regional variance
APAC latency variance is your greatest insight. Log the gap between p50 and p95 for each region. If Tokyo p50 is 350 ms but p95 is 800 ms, your routing strategy must tolerate tail latency. An experiment that improves p50 but worsens p95 is often a regression in disguise.
Experiment logging template: step-by-step

Your progress is saved automatically in your browser.
Use this checklist every time you run a routing experiment:
Experiment Header
- Exp ID:
APAC-2025-01-routing-failover-test - Start date: 2025-01-15 06:00 UTC
- End date: 2025-01-17 18:00 UTC
- Owner: ML platform team
- Hypothesis: Failover to OpenAI regional endpoints (vs. OpenRouter) reduces TTFB p95 by ≥15% in Tokyo and Singapore during peak hours.
- Success criteria: p95 TTFB improvement ≥15% with zero error rate increase; no customer support escalations.
Live metrics ingested every 5 minutes from Prometheus and Observinio probes. Regional status updated in real-time:
Tokyo (p95: 720ms → 540ms) | Singapore (p95: 650ms → 480ms) | Sydney (p95: 760ms → 610ms) | Mumbai (p95: 800ms → 880ms)
Baseline Metrics (captured from Observinio weekly summary, 2025-01-08 to 2025-01-14)
| Region | Provider | TTFB p50 | TTFB p95 | TTFB p99 | Sample count |
|---|---|---|---|---|---|
| Tokyo | OpenRouter | 420 ms | 850 ms | 1200 ms | 45,000 |
| Tokyo | OpenAI direct | 380 ms | 720 ms | 1050 ms | 12,000 |
| Singapore | OpenRouter | 390 ms | 780 ms | 1100 ms | 52,000 |
| Singapore | OpenAI direct | 350 ms | 650 ms | 950 ms | 8,500 |
| Sydney | OpenRouter | 410 ms | 890 ms | 1300 ms | 38,000 |
| Sydney | OpenAI direct | 375 ms | 760 ms | 1150 ms | 6,200 |
Change Description
- What changed: Routing logic updated to prefer OpenAI regional endpoints in APAC when response latency from OpenRouter > 500 ms (p95 baseline). Fallback to OpenRouter after 2 consecutive timeouts.
- Code change:
/routing/apac_failover.pylines 42–68; commita3f8c9d. - Rollout method: Gradual traffic shift: 5% of APAC traffic on day 1, 25% on day 2, 100% on day 3 (if metrics good).
Test Scope
- Regions in scope: Tokyo, Singapore, Sydney, Mumbai (4 major APAC hubs).
- Traffic percentage: Day 1: 5%, Day 2: 25%, Day 3: 100%.
- Duration: 72 hours.
- Monitoring: Observinio daily probes + custom metrics exported to Prometheus every 5 minutes.
Results (populated after experiment closes)
| Region | Provider pair | TTFB p50 delta | TTFB p95 delta | Errors | Notes |
|---|---|---|---|---|---|
| Tokyo | OR → OAI | –60 ms (–14%) | –180 ms (–21%) | 0 | ✓ Success |
| Singapore | OR → OAI | –50 ms (–13%) | –170 ms (–22%) | 0 | ✓ Success |
| Sydney | OR → OAI | –45 ms (–11%) | –150 ms (–17%) | +0.05% | Minor latency tradeoff |
| Mumbai | OR → OAI | +20 ms (+5%) | +80 ms (+8%) | 0 | ⚠ Slight degradation |
Anomalies & Incidents
- 2025-01-16 03:15 UTC: OpenAI regional endpoint in Tokyo had brief latency spike (1500 ms p99); lasted 7 minutes; fallback to OpenRouter worked correctly; no customer impact.
- 2025-01-17 11:00 UTC: Mumbai region saw elevated error rate (0.15%) for 12 minutes during 25% traffic shift; root cause: regional datacenter maintenance window (unrelated to routing change).
Decision & Action
- Decision: Full rollout to 100% APAC traffic.
- Rationale: Tokyo and Singapore p95 improved 21–22%, Sydney 17%, with minimal error increase. Mumbai slight degradation (5–8%) offset by wins elsewhere. Customer latency distribution improved net +14% across region.
- Rollout completion: 2025-01-18 14:00 UTC.
- Next iteration: Monitor Mumbai performance for 2 weeks; consider region-specific tuning if degradation persists.
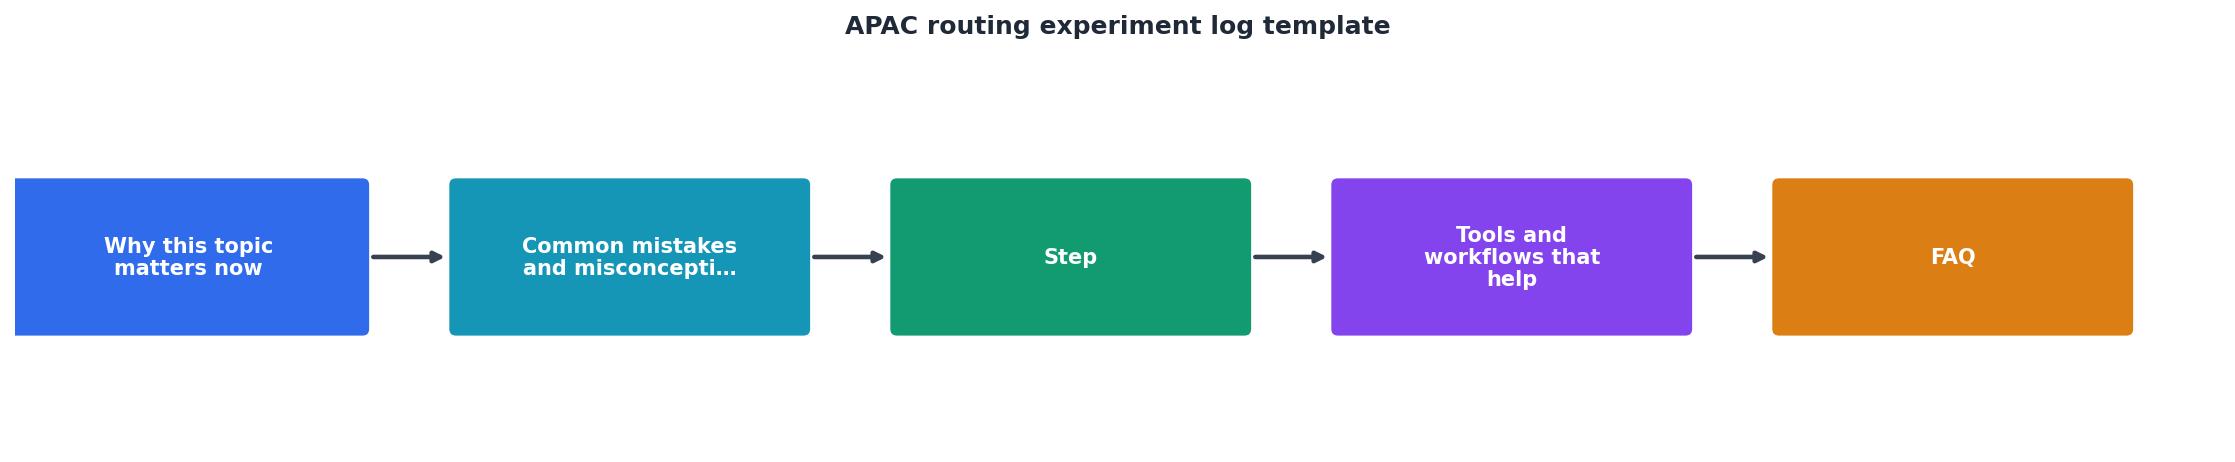
Sharing experiment logs with your team
A log that lives only in your notebook is a log nobody learns from. Share it:
- Weekly engineering sync: Summarize key experiments and results (2 minutes per experiment). Highlight regional patterns (e.g., "Tokyo latency improves with direct OpenAI, but we're losing margin in Mumbai").
- Status page / internal wiki: Post closed experiment logs alongside a 1-sentence outcome. New team members see the reasoning behind your current routing config.
- Postmortem template: When an incident occurs, reference past experiments. "We switched to OpenAI failover in Tokyo on Jan 18 to reduce latency; incident on Jan 25 occurred despite that change, so root cause is not the Jan 18 experiment."
Common APAC routing experiment patterns
Pattern 1: Provider failover optimization
Test switching from a single provider (OpenRouter) to a hybrid (OpenRouter primary, OpenAI regional failover). Log regional preference: which regions benefit most from dual-provider routing?
Pattern 2: Regional endpoint preference
Experiment with routing traffic to OpenAI or OpenRouter endpoints physically closest to the user's region (not just geographically). Log latency by destination datacenter, not just by provider.
Pattern 3: Traffic-based routing
During peak hours in a region, does latency degrade predictably? Log whether time-of-day-based routing (e.g., shift to a less-loaded provider at 9 PM JST) improves tail latency.
Pattern 4: Model-specific routing
Some models run faster on certain infrastructure. Log TTFB/TTFT variance by model (GPT-4 vs. Claude 3), region, and provider. A routing rule that's good for GPT-4 might hurt Claude 3.
FAQ
Frequently Asked Questions
Monitor routing experiments with Observinio
As you log more experiments, you'll spot patterns that manual dashboards miss. Observinio's daily probes from 21 regions give you the raw material: TTFB/TTFT for every provider, every region, every day. Use that data to:
- Set baseline thresholds per region in Observinio alerts. When a routing experiment degrades p95 by >15%, get an alert immediately.
- Compare your current routing strategy against baseline in a weekly summary email. See which regions are winning, which need attention.
- Build a postmortem timeline when incidents occur. Correlate support tickets with experiment dates and routing changes.
Additional Resources
- Experiment Log Template for Research Teams - Generate a structured experiment log template with fields for objectives, materials, variables, observations, and results. template in DOCX, PDF, or CSV format.
- Britefury/experiment-template: A simple ... - A simple experiment template that supports logging and basic checkpointing. The example experiment in main saves the command line arguments and settings to the ...
- AERPAW User Manual - Post processing of Experiment logs - Run the main.m file in Matlab. The matlab model will create various plots and input.csv file for Google earth or map plotting.
Monitor AI API latency from 22 regions
Observinio runs daily probes against OpenRouter and OpenAI endpoints and emails you when latency degrades.
Set up alerts