AI API incident runbook template
When an AI API provider starts returning 500 errors at 2 AM or your chat completion latency spikes from 180 ms to 4 seconds in a single region, the last thing you want is an engineer scrambling through Slack threads to figure out what to do next. A well-structured incident runbook turns panic into process. This template gives you a ready-to-use framework specifically designed for teams that depend on third-party LLM APIs, OpenAI, OpenRouter, Anthropic, and similar providers, in production.

Photo by Matheus Bertelli from Pexels
When an AI API provider starts returning 500 errors at 2 AM or your chat completion latency spikes from 180 ms to 4 seconds in a single region, the last thing you want is an engineer scrambling through Slack threads to figure out what to do next. A well-structured incident runbook turns panic into process. This template gives you a ready-to-use framework specifically designed for teams that depend on third-party LLM APIs, OpenAI, OpenRouter, Anthropic, and similar providers, in production.
TL;DR
- An AI API incident runbook codifies detection, triage, escalation, and resolution steps so on-call engineers act consistently under pressure.
- The template below covers the full lifecycle: from automated alert firing through communication, mitigation, and postmortem.
- Tailor severity levels to your latency SLOs, a 2× TTFB spike in one region is a different beast than a global outage.
- Pair the runbook with synthetic monitoring (like Observinio's 21-region probes) so you detect degradation before users report it.
- Review and drill the runbook quarterly; stale runbooks are almost as dangerous as having none at all.
Why AI API incidents are different

Traditional API incident playbooks assume you control the backend. With third-party AI APIs, you do not. That fundamental difference changes how you detect, diagnose, and mitigate problems:
- Limited observability. Provider status pages often lag reality by 10–30 minutes. You cannot inspect their internal queues, GPU utilization, or routing logic. Your only reliable signal is what you measure from the outside, TTFB, TTFT, error rates, and throughput from your own vantage points.
- Regional variance is the norm. A model served from US-East may respond in 150 ms for a Virginia-based client and 900 ms for one in Singapore. During degradation, some regions may be completely unaffected while others are unusable. Your runbook must account for partial outages, not just binary up/down states.
- Model-level granularity matters. A provider can be healthy for GPT-4o-mini while GPT-4o is timing out. Runbooks need to specify which model endpoints to check and what "healthy" looks like for each.
- Fallback routing is your primary mitigation lever. Unlike internal services where you might scale horizontally or roll back a deploy, your main options with external APIs are switching models, switching providers, or switching regions. The runbook must document these fallback paths explicitly.
Incident severity levels for AI APIs
Before you can triage, you need shared definitions. Here is a four-tier severity model calibrated for AI API latency and availability:
| Severity | Condition | Example | Response time |
|---|---|---|---|
| SEV-1 Critical | Complete API unavailability or >95% error rate across all regions | Provider returns 503 globally for >2 minutes | Immediate page, all hands |
| SEV-2 Major | Latency exceeds 3× baseline in multiple regions or error rate >10% | TTFB jumps from 200 ms to 700 ms in EU and APAC | Page on-call, begin mitigation within 15 min |
| SEV-3 Minor | Latency exceeds 2× baseline in a single region or error rate 2–10% | US-West TTFT degrades from 300 ms to 650 ms | Alert on-call, investigate within 30 min |
| SEV-4 Informational | Latency elevated but within SLO, or intermittent errors <2% | Occasional 429 rate-limit responses during peak | Log and review in next business day standup |
Adjust the thresholds to match your own SLOs. The key principle is that severity should be tied to user impact, not just raw numbers.
"Define exact metrics such as latency below 200ms, error rate under 0.5%, or successful API health checks.">, Incident Response Runbooks: Templates, Examples & Guide
The runbook template: step by step
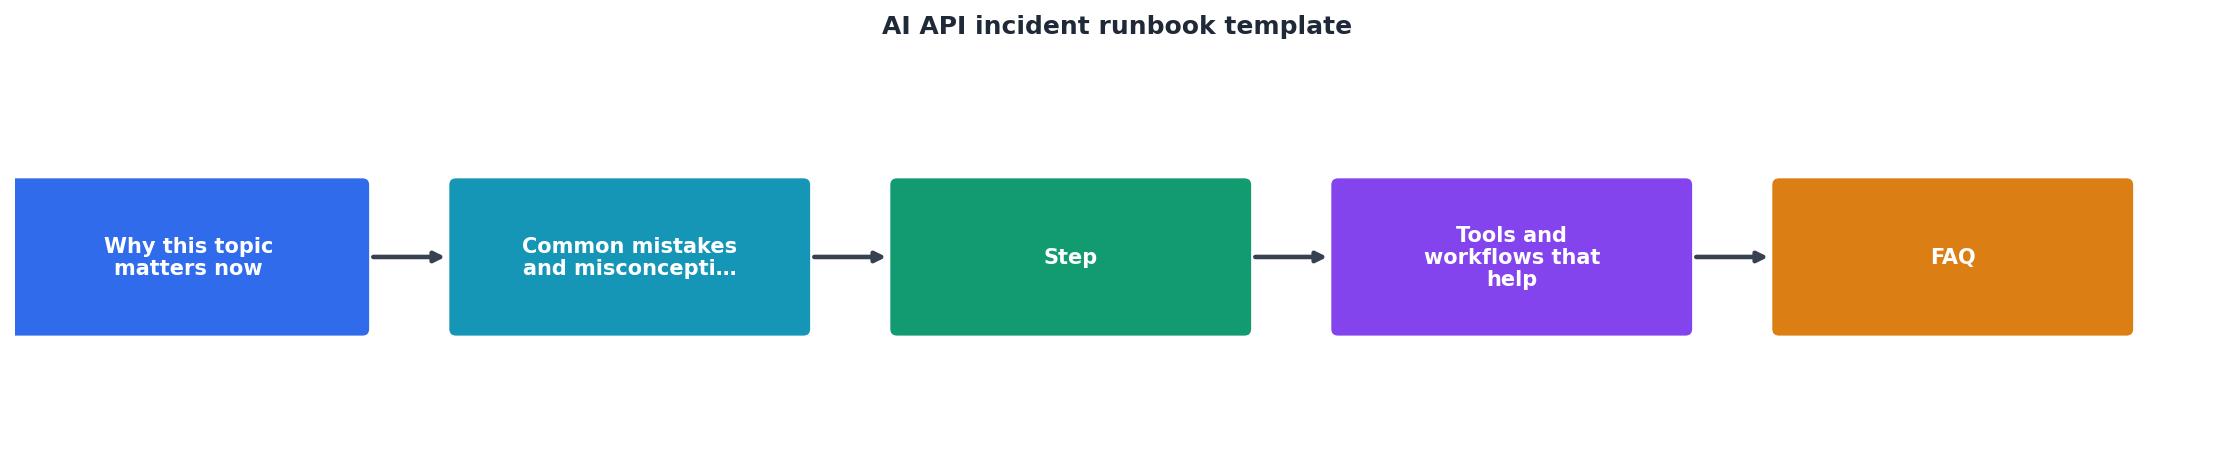
Below is the complete runbook template. Copy it into your wiki, incident management tool, or Git repository and customize the bracketed placeholders for your environment.
Step 1: Detection and alert validation
- Receive the alert. Confirm which monitoring system fired: synthetic probe (e.g., Observinio), APM (e.g., Datadog, Grafana), or user report.
- Check the scope. Open your monitoring dashboard and answer three questions:
- Which provider and model are affected? (e.g., OpenRouter →
anthropic/claude-3.5-sonnet) - Which regions show degradation? (e.g., EU-West, APAC-Southeast)
- When did the anomaly start? (Note the exact UTC timestamp.)
- Validate the alert is not a false positive. Run a manual probe or curl request from at least two regions:
curl -o /dev/null -s -w "TTFB: %{time_starttransfer}s | Total: %{time_total}s\n" \
  -X POST https://openrouter.ai/api/v1/chat/completions \
  -H "Authorization: Bearer $OPENROUTER_API_KEY" \
  -H "Content-Type: application/json" \
  -d '{"model":"openai/gpt-4o","messages":[{"role":"user","content":"ping"}]}'
- Assign severity using the table above. Document your reasoning in the incident channel.
Step 2: Communication and escalation
- Open an incident channel (e.g.,
#incident-ai-api-YYYY-MM-DDin Slack or Teams). - Post the initial situation report using this template:
🚨 INCIDENT OPENED, [SEV-X]
Provider: [OpenAI / OpenRouter / other]
Model: [model identifier]
Affected regions: [list]
Impact: [user-facing description, e.g., "Chat responses timing out for EU users"]
Detection source: [Observinio alert / APM / user report]
Start time: [UTC timestamp]
On-call engineer: [@name]
- Notify stakeholders according to severity:
- SEV-1/SEV-2: Product manager, engineering lead, customer support lead.
- SEV-3: Engineering lead only.
- SEV-4: No immediate notification; log for standup.
- Check the provider's status page and note whether they have acknowledged an issue. Link it in the channel. Do not wait for their acknowledgment to begin mitigation.
Step 3: Diagnosis

- Isolate the layer. Determine whether the issue is in the provider, the network path, or your own infrastructure:
- Compare synthetic probe results (external) with your application-level metrics (internal). If external probes show the same degradation, the problem is upstream.
- Check if other providers serving the same model family are also degraded. If OpenAI direct and OpenRouter-to-OpenAI are both slow, the root cause is likely at OpenAI.
- Review your own deployment logs for recent changes (new code, config updates, DNS changes).
- Characterize the failure mode:
- Latency degradation: Responses arrive but slowly. Check TTFB and TTFT separately, a normal TTFB with slow TTFT suggests model inference delays, while a slow TTFB points to network or queue issues.
- Error spike: Note the HTTP status codes. 429 means rate limiting, 503 means capacity, 500 means internal provider error.
- Partial outage: Only some regions or models affected. Document which are healthy, these become your fallback targets.
- Record all findings in the incident channel with timestamps.
Step 4: Mitigation
This is where AI API incidents diverge most from traditional playbooks. Your mitigation options, in order of preference:
- Switch to a fallback model. If
gpt-4ois degraded, route traffic togpt-4o-miniorclaude-3.5-sonnet. Ensure your application supports model fallback via configuration or feature flag. - Switch to a fallback provider. If OpenRouter is degraded, route directly to the provider's API (or vice versa). This requires pre-configured API keys and endpoint mappings.
- Switch to a healthy region. If your application uses a regional proxy or edge function, reroute traffic away from the degraded region.
- Enable graceful degradation. If no healthy alternative exists, activate a degraded-mode UX: cached responses, longer timeout with a loading indicator, or a user-facing message explaining temporary slowness.
- Reduce traffic volume. Implement request queuing, reduce batch sizes, or temporarily disable non-critical AI features to lower load on the remaining healthy path.
Step 5: Monitoring recovery
- Watch your dashboards for at least 15 minutes after mitigation to confirm the fix holds.
- Compare current metrics to baseline. Use your monitoring tool's baseline comparison feature to verify latency has returned to normal ranges across all affected regions.
- Re-enable original routing only after the provider confirms resolution and your probes show stable performance for at least 30 minutes.
- Post a resolution update in the incident channel:
✅ INCIDENT RESOLVED, [SEV-X]
Resolution time: [UTC timestamp]
Duration: [X minutes]
Root cause: [brief description]
Mitigation applied: [what you did]
Provider status: [resolved / monitoring]
Step 6: Postmortem

Schedule a postmortem within 48 hours for any SEV-1 or SEV-2 incident. For SEV-3, a written async review is sufficient. Cover these points:
- Timeline: Minute-by-minute reconstruction from detection to resolution.
- Detection gap: How long between the start of degradation and the first alert? If users reported it before your monitoring caught it, that is a gap to close.
- Mitigation effectiveness: Did the fallback work? How long did the switchover take? Were there unexpected side effects (e.g., different model behavior, higher costs)?
- Action items: Concrete, assigned, and time-boxed. Examples:
- Add synthetic probes for the affected model/region combination by next Friday.
- Implement automatic model fallback in the routing layer within two sprints.
- Update the runbook with the new failure mode discovered during this incident.
Runbook maintenance checklist
A runbook is only useful if it reflects your current architecture and provider landscape. Use this quarterly checklist:
Your progress is saved automatically in your browser.
Frequently Asked Questions
Start detecting AI API incidents faster
The best runbook in the world cannot help if you do not know an incident is happening. Observinio monitors OpenAI and OpenRouter endpoints from 21 global regions with daily synthetic probes, compares results against latency baselines, and sends email alerts when performance degrades. Pair this template with real-time regional visibility so your on-call team gets paged minutes into an incident, not hours. Check the Observinio status page to see current provider performance, or get in touch to set up alerts for your critical models and regions.
Download the runbook template
Copy this complete AI API incident runbook into your team wiki or Git repository and customize the bracketed placeholders for your environment. Pair it with Observinio's real-time status dashboard to close the detection gap and start responding to provider degradation in minutes instead of hours.
Get started with ObservinioAdditional Resources
- Incident Response Runbooks: Templates, Examples & Guide - Incident response runbooks made practical: copy-paste templates, real-world examples, and a step-by-step framework to standardize response and cut MTTA and ...
- Incident Runbook Templates | Happycapy Skills - Install Production-ready templates for incident response runbooks covering detection, triage, mitigation, resolution, and communication
- On-Call Runbook Template: A Framework That Works at 3AM - This post gives you a practical on-call runbook template built for SREs and on-call engineers who actually get paged. It includes a 5-phase response framework, ...
Monitor AI API latency from 22 regions
Observinio runs daily probes against OpenRouter and OpenAI endpoints and emails you when latency degrades.
Set up alerts