

Your users are complaining that the AI-powered chat in your product feels sluggish. Your on-call engineer sees elevated P95 latency but cannot tell whether the bottleneck is your code, the network, or the upstream LLM provider. Before you start rewriting your inference pipeline or switching models, you need a structured way to isolate the problem. This checklist gives you exactly that, a repeatable, step-by-step triage process that moves from the cheapest checks to the most involved, so you stop guessing and start measuring.
TL;DR
- Slow AI features usually stem from one of five layers: client code, network path, API gateway/router, the LLM provider itself, or prompt/payload size.
- Always start triage by checking the provider's external status before diving into your own stack.
- Measure Time to First Byte (TTFB) and Time to First Token (TTFT) separately, they reveal different failure modes.
- Regional latency variance is real: a model that responds in 180 ms from Virginia may take 600 ms from Mumbai.
- Automated synthetic probes from multiple regions eliminate guesswork and cut Mean Time to Resolution (MTTR) dramatically.
Why AI Latency Triage Is Different

Traditional API triage follows a well-known pattern: check your server, check the database, check the downstream service. LLM API calls add several complications that break the usual playbook.
First, response times are inherently variable. A completion call to GPT-4o might return in 400 ms for a short prompt and 4 seconds for a long one, both within normal operating parameters. Without a per-model, per-region baseline, you cannot distinguish "slow" from "normal for this payload."
Second, streaming changes the meaning of latency. When you stream tokens, the metric that matters to user experience is TTFT, the time until the first token appears on screen. A request with a 200 ms TTFT and a 3-second total duration feels fast. A request with a 2-second TTFT and the same total duration feels broken. Your monitoring must capture both numbers independently.
Third, routing layers add opacity. If you use OpenRouter or a similar aggregator, your request may be forwarded to any of several backend providers. A latency spike could originate at the router, at the selected backend, or in the handoff between them. Without external probes hitting both the router and the direct endpoint, you are debugging blind.
Finally, geography matters more than most teams realize. LLM inference endpoints are not uniformly distributed. A provider may have capacity in us-east-1 and eu-west-1 but nothing in Asia-Pacific. If your users are in Singapore, every request crosses an ocean before inference even begins. Regional synthetic probes, like the ones Observinio runs from 21 global regions, expose these gaps before your users feel them.
The Five-Layer Triage Model
Before you touch any code, mentally map the request path into five layers. Each layer has distinct symptoms and distinct diagnostic tools.
- Client layer, your application code, SDK version, connection pooling, retry logic.
- Network layer, DNS resolution, TLS handshake, TCP round-trip to the API endpoint.
- Router layer, if you use OpenRouter or a load balancer, this is the intermediary that selects a backend.
- Provider layer, the LLM inference service itself (OpenAI, Anthropic, Mistral, etc.).
- Payload layer, prompt length, system message size, max-token settings, tool/function definitions.
The Triage Checklist: Step by Step
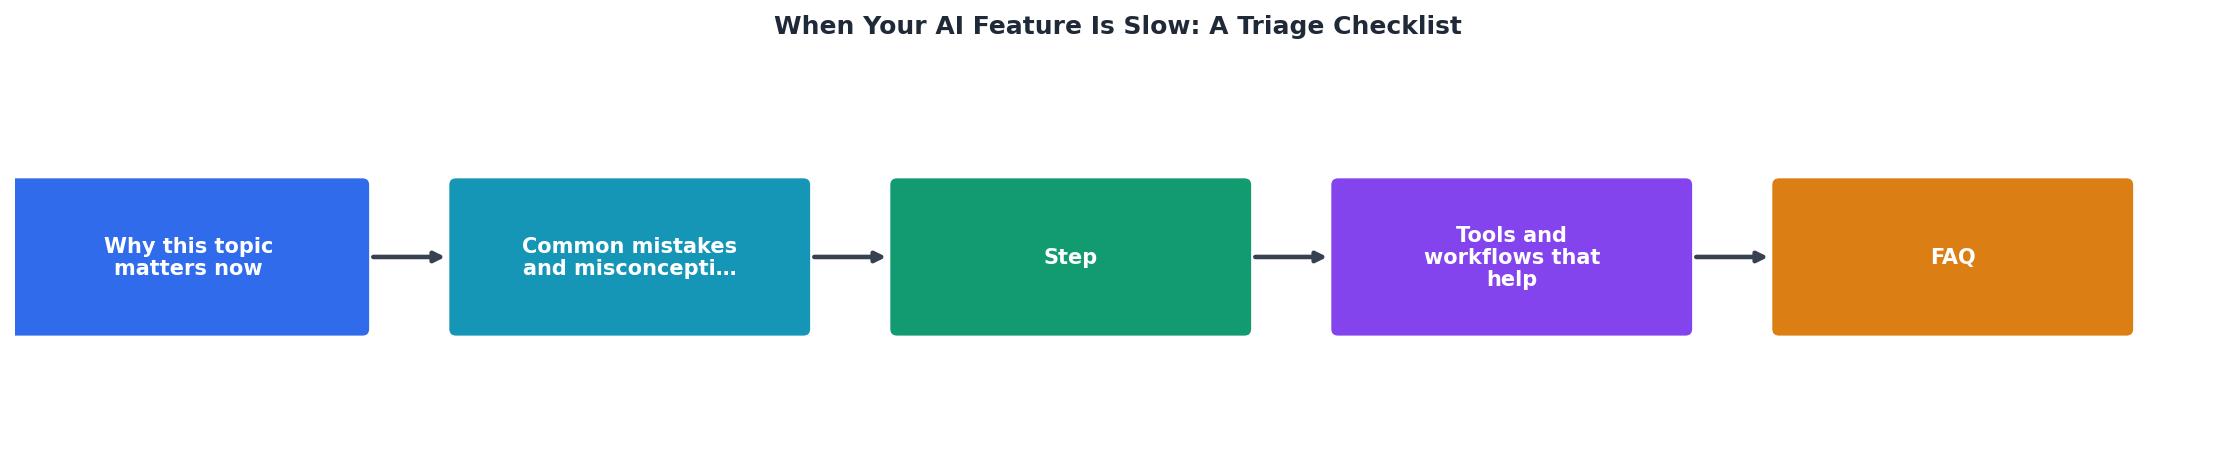
Your progress is saved automatically in your browser.
Regional Variance: The Hidden Multiplier

One of the most underestimated factors in AI feature latency is the physical distance between your users and the inference endpoint. Here is what regional variance looks like in practice:
| Region | Typical TTFB to OpenAI (us-east) | Notes |
|---|---|---|
| US East | 40–80 ms | Same-region, minimal overhead |
| US West | 80–130 ms | Cross-continent hop |
| EU West | 120–200 ms | Transatlantic cable latency |
| Southeast Asia | 250–400 ms | Multiple hops, high variance |
| South America | 200–350 ms | Limited peering paths |
The only way to catch regional degradation proactively is to run synthetic probes from each region your users occupy. Observinio does this from 21 regions daily, comparing each measurement against the established baseline and alerting you via email when a specific region degrades beyond its normal range.
"Our IT team was overwhelmed by the sheer volume of security alerts and doesn't have the resources for 24/7 monitoring.", Andriy H., Co-Founder and CTO UnderDefense G2 – Verified Review." >, AI
This sentiment resonates with ML platform teams too. You cannot manually monitor latency from twenty-one regions around the clock. Automated probes and threshold-based alerts are the only scalable approach.
⚡ Quick Triage Decision Matrix
| Symptom | Most Likely Layer | First Action |
|---|---|---|
| All models slow globally | Provider | Check provider status page |
| Slow only in specific regions | Network | Run regional TTFB probes |
| Router slower than direct | Router | Compare router vs. direct endpoint |
| Latency grows with conversation length | Payload | Audit token count per request |
| Intermittent spikes, no provider issues | Client | Check connection pooling and retries |
Building a Repeatable Triage Runbook
A checklist is only useful if your team actually follows it during incidents. Here is how to operationalize the steps above:
- Document your baselines. For every model-region pair you use in production, record the P50 and P95 TTFT. Update these monthly or whenever you change models.
- Create a shared runbook. Put the six triage steps into your incident response wiki. Link directly to your Observinio dashboard, provider status pages, and the
curlcommands above. - Set alert thresholds. Configure Observinio degradation alerts at 1.5× your P95 baseline. This catches real regressions without firing on normal variance.
- Run postmortems. After every latency incident, record which layer was the root cause. Over time, you will see patterns, maybe 60% of your incidents are payload-related, which tells you where to invest in optimization.
- Review weekly summaries. Observinio's weekly latency summary emails give you a trend view without requiring you to check dashboards daily. Use them in your team's weekly ops review.
Frequently Asked Questions
curl, the time_starttransfer metric approximates TTFB, which closely correlates with TTFT for streaming requests. Provider SDKs like the OpenAI Python library also emit timing events you can hook into.Start Triaging With Data, Not Guesses
The difference between a 10-minute resolution and a 2-hour war room is almost always data. If you have regional baselines, continuous probes, and clear alert thresholds, you can walk through this checklist in minutes and pinpoint the layer causing the slowdown. If you are flying blind, no baselines, no external probes, no regional visibility, every incident becomes a guessing game. Observinio's daily probes across 21 regions, baseline comparisons, and email degradation alerts give you the data layer this checklist depends on. Set up alerts once, and the next time your AI feature feels slow, you will already know where to look.
Additional Resources
- AI-Enabled Incident Triage: Implementation Playbook - Implementation Readiness Checklist: Is Your SOC Prepared for AI-Enabled Triage? Before deploying AI triage, score your SOC against these 10 ...
- AI Alert Triage: Fix Analyst Fatigue & False Positives - Learn how AI alert triage reduces false positives, improves prioritization, and eases analyst fatigue in modern SOC operations.
- Artificial Intelligence Decision Support for Medical Triage - PMC - The system evaluates care alternatives through interactions with patients via a mobile application. simply suggests a list of all potential diagnoses, ranking ...