
Photo by Jonathan Borba from Pexels
When users interact with LLM-powered chat interfaces, every millisecond matters. The difference between a snappy, responsive chat experience and a sluggish one often comes down to how well you understand and optimize token streaming latency. Most platform teams focus on either time-to-first-token (TTFB) or total request duration, but rarely both, which leaves critical gaps in production reliability.
Token streaming latency encompasses two distinct but equally important metrics: how long before the first token arrives (TTFB, also called "time-to-first-byte" in HTTP contexts), and how consistently tokens flow after that (throughput and tail latency). Both directly impact perceived speed. Users notice both the initial delay before the response starts and the frustration of a chatbot that starts fast but then stalls.
Key takeaway
Token streaming latency directly affects user retention and satisfaction. Fast time-to-first-token (under 300 ms) combined with consistent streaming throughput creates the perception of responsiveness. Regional variance is hidden by global averages—teams that monitor latency from multiple geographies uncover critical performance gaps their users experience but dashboards hide. Optimizing both TTFB and streaming throughput, not one or the other, is essential for production LLM reliability.
TL;DR
- TTFB (Time-to-First-Token) is what users feel most keenly, latency from request sent to first token received. Anything over 500 ms feels sluggish for chat; aim for under 300 ms for premium experience.
- Regional variance matters: the same API call from Tokyo may see 800 ms TTFB while London gets 250 ms. Direct provider endpoints and OpenRouter can vary significantly by region, and you need to measure it.
- Streaming throughput (tokens per second after the first token) is separate from TTFB but equally critical. A slow token stream makes even fast-starting responses feel janky.
- Provider choice and routing strategy have measurable impact. Switching from one provider to another, or using a regional replica, can cut TTFB by 30–50% for specific geographies.
- Continuous monitoring from 21 regions (or similar global coverage) is the only reliable way to catch regional degradation before it hits your customers.
Why Token Streaming Latency Matters for User Experience

User experience in LLM applications is not binary, it is not "working" or "broken." It exists on a spectrum, and latency is one of the strongest predictors of user satisfaction and retention. Research into API user experience shows that perceived responsiveness drops sharply beyond 400–500 ms of initial delay. When users type a prompt into a chat interface and see nothing for half a second, they often assume the request failed or the service is overloaded.
Token streaming adds complexity because it offers a psychological advantage: progressive disclosure. The moment the first token appears, users know the system is working and receiving their request. That visual feedback reduces perceived latency by up to 30% compared to waiting for the entire response at once. However, this only works if TTFB is fast enough. If the first token takes 2 seconds, progressive disclosure becomes a liability, users see a long blank delay followed by text trickling in slowly.
The second component, streaming throughput, affects the entire interaction. A response that takes 15 seconds to fully stream out (at 4 tokens per second) feels laborious compared to one that completes in 5 seconds (at 12 tokens per second). Users may abandon long-form completions or stop following along if the token stream stalls.
"Most teams optimise one and ship the other.">, Optimizing Latency for Human vs Service Calls
This is the silent killer in production LLM systems: teams optimize TTFB with caching and edge routing but neglect streaming throughput, or vice versa. The result is a fractured user experience where some requests start fast but dribble in slowly, or some requests take forever to start but then complete instantly. Both damage user trust and increase support load.
Understanding Token Streaming Latency Metrics
Token streaming introduces several measurable components:
- Time-to-First-Token (TTFB): The interval from when the user sends a request until the first token is received and ready for display. This includes network roundtrip time, API processing time, and any routing or batching delays.
- Token Generation Rate: The number of tokens per second the API produces after TTFB. This depends on model throughput, batch size, and GPU allocation at the provider.
- End-to-End Latency (E2E): Total time from request to final token. Useful for capacity planning but less predictive of UX than TTFB.
- P95 and P99 Tail Latencies: The latency at the 95th and 99th percentiles. APIs that serve mostly requests in 200 ms but occasionally hit 5 seconds will create unpredictable, frustrating user experiences. Tail latency matters as much as median.
- Regional Variance: The difference in latency for the same request from different geographies. A 100 ms request from London may be 400 ms from Sydney due to network distance and provider infrastructure placement.
How Regional Variance Breaks Assumptions
Most teams monitor API latency from a single region or aggregate global traffic into one dashboard metric. This hides critical regional asymmetries. When OpenAI or OpenRouter reports average latency of 150 ms globally, that figure masks a reality where US West Coast calls average 120 ms but Tokyo calls average 600 ms.
Consider a real scenario: your chat product has users worldwide, but your monitoring runs only from your data center in Virginia. You see TTFB hovering around 200 ms and declare victory. In reality, 30% of your user base in Southeast Asia is experiencing 800–1200 ms latency because provider infrastructure is not evenly distributed. Those users churn silently while your dashboard looks green.
Observinio's approach of probing from 21 global regions mirrors the geographic spread of real user traffic and surfaces these blind spots. By testing the same OpenRouter or OpenAI endpoint from Tokyo, London, São Paulo, and Sydney simultaneously, you see the latency distribution your actual users experience, not an optimistic aggregate.
Measuring Token Streaming Latency in Production
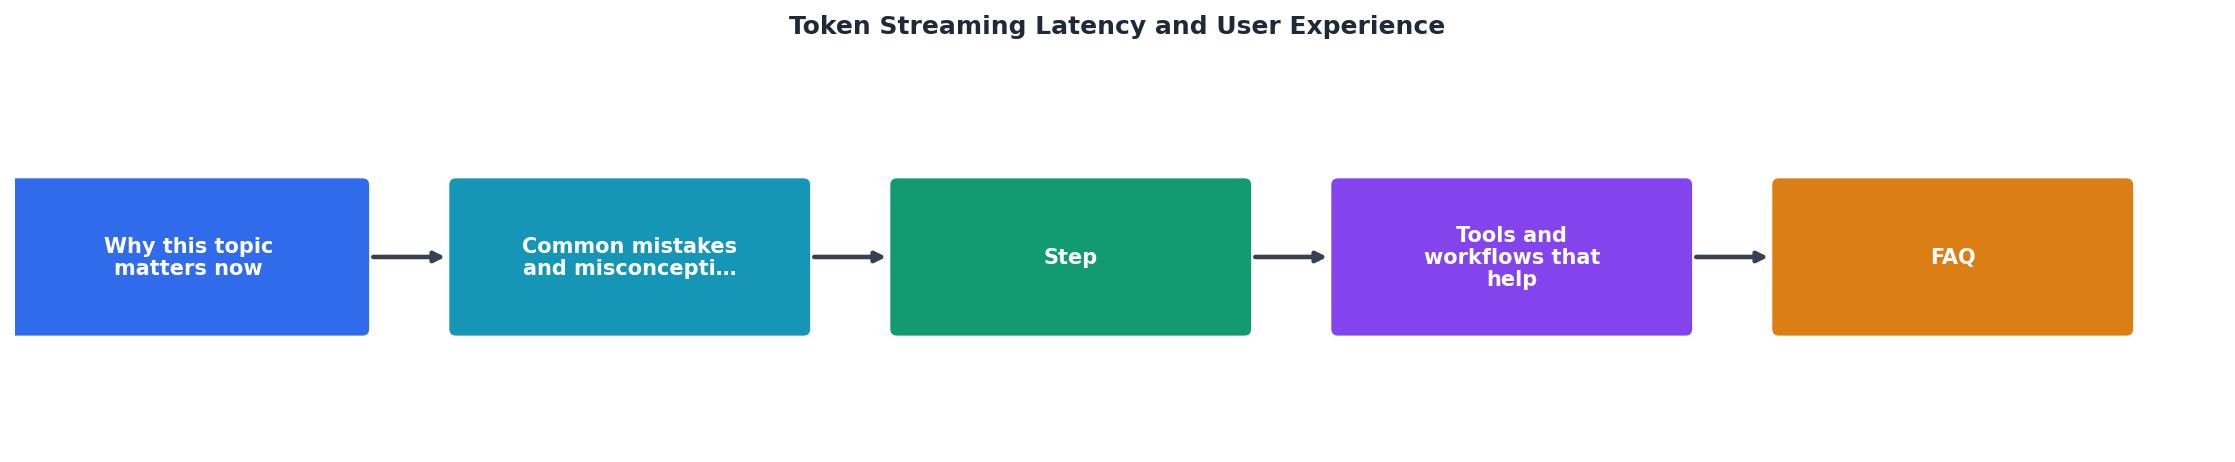
Effective monitoring requires both synthetic probes and instrumentation of real traffic. Synthetic probes (like Observinio's daily checks) give you a stable baseline and alert you to degradation. Real traffic instrumentation shows you what users actually experience.
Step-by-Step: Setting Up Latency Monitoring
- Instrument your SDK or HTTP client to capture when the request is sent and when the first token arrives. This delta is TTFB. Log it with request ID, user region (inferred from IP or explicit), model, and provider.
- Separate upstream latency from your stack. Measure both client-to-API latency (what Observinio probes) and API-to-your-backend latency. If your routing layer adds 50 ms, your users' perceived TTFB = client latency + 50 ms.
- Set up regional synthetic probes from at least 4–5 major geographies. Include US East and West, Europe, and Asia-Pacific. If your users skew heavily toward a region (e.g., India), add a probe there.
- Establish baselines and SLOs. Decide what acceptable TTFB is for your use case:
- Chat completions: aim for < 300 ms TTFB at P95, < 500 ms at P99.
- Long-form generation (essays, reports): < 500 ms acceptable if streaming throughput is smooth.
- Latency-sensitive (live suggestions, autocomplete): < 150 ms TTFB required.
- Set up alerts for:
- TTFB exceeding your SLO in any region.
- Streaming throughput dropping below expected tokens/second (indicating model queueing or slowdown).
- Regional variance spikes (e.g., Asia latency suddenly 2x normal).
- Weekly review: Compare TTFB trends across regions and providers. If OpenRouter's Asia latency degrades while OpenAI's holds steady, that points to a provider-specific issue, not your infrastructure.
Your progress is saved automatically in your browser.
Optimizing for Streaming Latency

Once you measure latency, optimization becomes data-driven. The highest-impact levers:
💡 Optimization Priority Framework
Phase 1 (0–2 weeks): Establish baselines and regional monitoring. Identify where your users experience the worst latency. Minimal code changes needed.
Phase 2 (2–4 weeks): Benchmark providers and models. Pilot provider switch or regional routing if 20+ ms improvement is visible. Low risk, high visibility.
Phase 3 (4+ weeks): Deploy fallback logic, queue management, and edge routing. Larger engineering effort but highest long-term ROI.
1. Provider and Region Selection
Direct API calls to OpenAI or Anthropic from US regions typically see 80–200 ms TTFB. The same call from Tokyo may hit 600 ms due to network distance and server placement. OpenRouter abstracts this variability but introduces routing latency (typically +20–50 ms). The tradeoff: OpenRouter offers regional load balancing and fallback, while direct calls are predictable but require you to handle regional failures.
Action: Benchmark TTFB for your primary use cases (e.g., chat completion, few-shot generation) against OpenRouter and direct endpoints from the regions where your users are concentrated. A 200 ms difference is significant; a 50 ms difference is worth investigating if you have strict SLOs.
2. Model and Throughput Selection
Not all models stream at the same rate. GPT-4 Turbo may achieve 15–20 tokens/sec on standard hardware, while smaller models (GPT-3.5, Llama) can reach 30+ tokens/sec. For UX-sensitive applications (chat, real-time suggestions), a faster smaller model often beats a slower larger model, even if accuracy is slightly lower. Users prefer fast and accurate to slow and perfect.
Action: Test token generation rates (tokens/sec) for candidate models under load. If chat latency is a blocker, benchmark GPT-3.5 or similar against GPT-4 in your deployment. The speed-vs-quality tradeoff is often worth it.
3. Batch and Queue Management
Provider latency includes time waiting in the inference queue. During peak traffic, requests queue behind earlier ones. Observinio's regional probes will show this as sudden latency spikes during peak hours. Mitigating this:
- Use exponential backoff and retry logic for transient slowdowns.
- Consider request prioritization: high-priority chats (paying customers) get lower latency SLOs than low-priority ones.
- If a provider's latency degrades, fallback to a secondary provider (e.g., switch from OpenAI to OpenRouter or Claude).
4. Edge Routing and Caching
If you control your backend, place request ingestion as close as possible to your users. CDN-backed APIs can reduce initial handshake latency by 30–50 ms. Caching of common prompts or few-shot examples also reduces API calls, indirectly improving perceived latency.
Comparing Providers: Real-World Latency Variance
Without concrete benchmark data in this article, the principle is clear: latency varies dramatically by provider, model, region, and time of day. What matters is measuring your own use case rather than relying on vendor claims or anecdotes. Observinio's multi-region probes give you daily snapshots across 21 locations, making regional variance visible and actionable.
| Latency Target | Use Case | P95 TTFB | Notes |
|---|---|---|---|
| Chat completions | Real-time conversation | < 300 ms | Users expect immediate response start |
| Long-form generation | Essays, reports, code | < 500 ms | Slightly higher acceptable; quality often prioritized |
| Live suggestions | Autocomplete, in-editor hints | < 150 ms | Sub-100ms perceived as instantaneous |
| Batch processing | Async workflows, jobs | < 2 s | Latency less critical; throughput prioritized |
FAQ
Frequently Asked Questions
Next Steps: Monitor and Optimize Continuously
Token streaming latency is not a one-time measurement. Provider performance shifts with traffic, model updates, and infrastructure changes. Users in new geographies may have different latency profiles than your current base. The only way to stay ahead of latency regressions is continuous monitoring with regional coverage.
Set up daily synthetic probes from multiple regions using Observinio or a similar service. Configure alerts for TTFB SLO breaches and degradation trends. Review weekly summaries to spot patterns and inform provider or routing decisions. When latency spikes, use regional probe data to isolate whether it is a provider, network, or application issue, this reduces MTTR and improves incident response.
For teams serious about LLM-powered user experience, token streaming latency is not a nice-to-have metric; it is a core reliability indicator. Measure it, monitor it from your users' actual geographies, and optimize based on data.
Additional Resources
- Adaptive Token Pacing for Cognitive-Friendly LLM Streaming - Recent work has begun to explicitly connect serving mechanisms with user experience under token streaming. specific latency patterns affect ...
- Optimizing Latency for Human vs Service Calls - First-token latency is a UX metric. Total latency is a cost and capacity metric. Most teams optimise one and ship the other.
- Latency Optimization in LLM Streaming: Key Techniques - Monitoring and Optimization : Track metrics like time to first token (TTFT), token generation rate, request latency, and user engagement.