
Photo by Suzy Hazelwood from Pexels
Your application calls an LLM API, the response takes 14 seconds instead of the usual 1.2, and your on-call engineer spends the next 30 minutes trying to figure out whether the problem is in your code, your infrastructure, or the upstream provider. A well-designed status page for every AI dependency you rely on eliminates that guesswork. It gives your team a single, timestamped source of truth about provider health, before customers start filing tickets.
TL;DR
- Traditional status pages from AI providers often report only binary up/down states and miss latency degradations that directly affect user experience.
- A purpose-built AI dependency status page should track TTFB, TTFT, and regional variance, not just availability.
- You can combine provider-hosted status pages with independent synthetic probes to get a complete picture.
- Automating status checks from multiple regions turns reactive incident response into proactive alerting.
- Observinio's status dashboard already monitors OpenRouter and OpenAI endpoints from 21 regions, giving you a ready-made external reference point.
Why Traditional Status Pages Fall Short for AI APIs
Most AI API providers publish a status page, OpenAI uses Atlassian's StatusPage product, and OpenRouter maintains its own status endpoint. These pages are valuable, but they have structural blind spots that matter when you are running latency-sensitive LLM features in production.
The binary-state problem
A provider status page typically shows three states: Operational, Degraded Performance, and Major Outage. The transition from "Operational" to "Degraded Performance" is a manual or semi-automated decision made by the provider's incident team. In practice, this means a model endpoint can be responding 5× slower than its baseline for 15–20 minutes before the status page reflects any change. For a chat application where users expect sub-second time-to-first-token (TTFT), that delay is the difference between a minor blip and a wave of churn.
Aggregate vs. regional reality
Provider status pages almost never break down health by region. An endpoint might be perfectly healthy when called from US-East but experiencing packet loss or routing issues from Southeast Asia. If your users are in Singapore and the status page says "Operational," you have a false sense of security. Regional variance in AI API latency is not an edge case, it is the norm. Measurements across 21 global regions consistently show that TTFB for the same model and prompt can differ by 300–800 ms depending on the caller's location.
| Feature | Provider Status Page | Independent Probes |
|---|---|---|
| Regional latency breakdown | ❌ | ✅ |
| TTFB / TTFT tracking | ❌ | ✅ |
| Baseline deviation alerts | ❌ | ✅ |
| Real-time incident updates | ✅ | ❌ |
| Zero setup required | ✅ | ❌ |
Third-party component limitations
Integrating an external provider's status into your own StatusPage instance is not straightforward either. The provider must explicitly enable the integration on their side.
"In order for us to enable a page as a third-party component, we need to receive a request from the company itself so that we can go ahead with the enabling.">, Atlassian's StatusPage third party component
This means you cannot simply subscribe to OpenAI's component feed and embed it in your own dashboard without their cooperation. For teams that need a unified view of all dependencies, this is a blocker.
What a Good AI Dependency Status Page Actually Tracks

A status page built for AI API dependencies needs to go beyond red/yellow/green indicators. Here are the metrics and dimensions that matter:
Essential metrics
- Time to First Byte (TTFB): Measures how quickly the provider begins responding. A spike in TTFB usually indicates queuing or cold-start issues on the provider side.
- Time to First Token (TTFT): Specific to streaming LLM endpoints. This is the latency your user actually perceives, the gap between sending a prompt and seeing the first token appear.
- Total response time (P50, P95, P99): Percentile distributions reveal whether slowness is affecting all requests or just a tail. A healthy P50 with a ballooning P99 points to intermittent capacity issues.
- Error rate by status code: Distinguish between 429 (rate limit), 500 (server error), and 503 (overloaded). Each has a different remediation path.
- Baseline deviation: Raw numbers are less useful than deviation from a known baseline. A TTFT of 600 ms means nothing without context; a TTFT that is 3× the 7-day rolling average is an actionable signal.
Essential dimensions
- Region: Every metric should be segmented by the geographic location of the probe or caller. A status page that only shows a global average hides the most important signal.
- Model / endpoint: Different models on the same provider can have independent capacity pools. GPT-4o and GPT-4o-mini may degrade independently.
- Provider path: If you use OpenRouter, you have two layers, OpenRouter's routing infrastructure and the downstream model provider. Tracking both lets you isolate where degradation originates.
Building Your AI Dependency Status Page: A Step-by-Step Guide
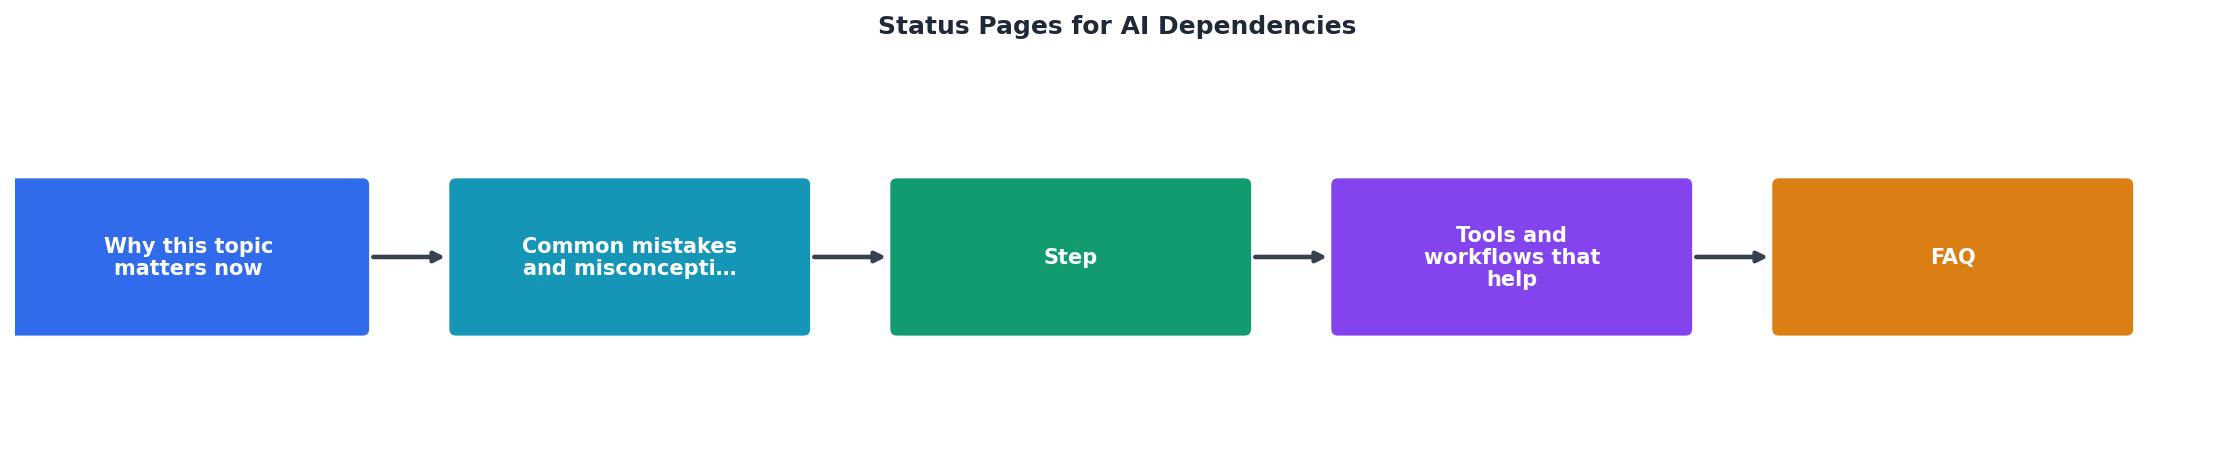
Follow these steps to create a status page that actually helps during incidents rather than just decorating your docs site.
Step 1: Inventory your AI dependencies
List every external AI API your application calls. For each, record:
- Provider name and base URL (e.g.,
https://openrouter.ai/api/v1,https://api.openai.com/v1) - Models used (e.g.,
gpt-4o,anthropic/claude-3.5-sonnet) - Regions where your users are concentrated
- Current SLA or latency expectations (even informal ones)
Step 2: Set up independent synthetic probes
Do not rely solely on the provider's own status page. Deploy synthetic probes that call each endpoint on a schedule, every 5 to 15 minutes, from every region that matters to your users. Each probe should send a minimal, deterministic prompt and record TTFB, TTFT, total duration, and HTTP status code.
You can build this yourself with a cron job and a lightweight script:
#!/bin/bash

START=$(date +%s%N)
HTTP_CODE=$(curl -s -o /dev/null -w "%{http_code}" \
  -X POST https://openrouter.ai/api/v1/chat/completions \
  -H "Authorization: Bearer $OPENROUTER_API_KEY" \
  -H "Content-Type: application/json" \
  -d '{"model":"openai/gpt-4o-mini","messages":[{"role":"user","content":"ping"}],"max_tokens":1}')
END=$(date +%s%N)
DURATION_MS=$(( (END - START) / 1000000 ))
echo "$(date -u +%FT%TZ) status=$HTTP_CODE duration_ms=$DURATION_MS"
Alternatively, skip the build step entirely and use a service like Observinio, which already runs probes from 21 regions against OpenRouter and OpenAI endpoints on a daily cadence and compares results against rolling baselines.
Step 3: Define thresholds and alert rules
For each dependency and region, set:
- Warning threshold: e.g., TTFT > 2× the 7-day P50 baseline.
- Critical threshold: e.g., TTFT > 5× baseline or error rate > 5%.
- Alert channel: email, Slack, PagerDuty, whatever your on-call workflow uses.
Step 4: Create the status view
Your status page should answer three questions at a glance:
- Is each dependency healthy right now? Show the latest probe result per region.
- Has anything changed recently? Display a 24-hour and 7-day latency trend chart.
- Are there active incidents? Link to the provider's own status page alongside your independent measurements.
Step 5: Publish and maintain

Decide whether your status page is internal-only or public-facing. Internal pages are simpler, no need to sanitize data or worry about competitive exposure. Public pages build trust with your own customers by showing that you actively monitor your supply chain. Either way, review the page weekly. Remove dependencies you have deprecated, add new models as you adopt them, and adjust thresholds as baselines shift after provider infrastructure changes.
Checklist: AI Dependency Status Page Readiness
Use this checklist before you consider your status page "done":
Your progress is saved automatically in your browser.
Common Pitfalls to Avoid
- Trusting a single data source. If you only check the provider's status page, you will miss regional degradations and slow-onset latency creep. Always pair provider pages with independent probes.
- Alerting on raw values instead of baselines. A TTFT of 800 ms might be normal for a large model but catastrophic for a small one. Baseline-relative thresholds reduce false positives dramatically.
- Ignoring the routing layer. When using OpenRouter, degradation can occur in OpenRouter's routing infrastructure independently of the downstream model provider. Monitor both layers.
- Setting and forgetting thresholds. Provider performance shifts over time, new model versions, infrastructure migrations, and capacity changes all move baselines. Recalculate automatically or review monthly at minimum.
- Over-aggregating regions. A global average that looks healthy can hide a region where 20% of your users are experiencing 5× normal latency. Always segment by region.
Key takeaway: Never rely on a single source of truth for AI API health. Combine provider status pages with independent synthetic probes running from multiple regions, and alert on baseline-relative deviations rather than raw latency values, to catch degradations before your users notice them.
Frequently Asked Questions
Start Monitoring Your AI Dependencies Today
If you are running LLM-powered features in production, you already have a dependency on external AI APIs, whether or not you have a status page for them. Observinio gives you a ready-made, region-aware status view for OpenRouter and OpenAI endpoints, complete with baseline comparisons and email alerts when latency degrades. Instead of building probe infrastructure from scratch, you can start with the Observinio status dashboard and get weekly latency summaries delivered to your inbox. Set up alerts in minutes and spend your engineering time on your product, not your monitoring pipeline.
Additional Resources
- ivbeg/awesome-status-pages - DownForAI - Status page aggregator for AI services with real-time monitoring of 800+ AI tools and APIs (OpenAI, Anthropic, Gemini, Groq, Midjourney, etc.). Free ...
- Atlassian's StatusPage third party component - We use OpenAPI as one of the dependencies of our product. We are building our status page and we would like to be able to show OpenAI status ...
- Justt.ai Status Page - The Justt.ai Status Page (status.justt.ai) provides real-time information about the operational status of all Justt services and APIs.