
Photo by tnfeez desgin from Pexels
When you monitor LLM APIs in production, latency is not one number, it splits into distinct measurement points depending on whether you're running chat completions or embedding jobs. A chat endpoint might report a 200 ms time-to-first-byte (TTFB) from New York but 600 ms from Singapore. An embeddings endpoint, by contrast, processes batches synchronously with no streaming, making TTFB less relevant than total request time and batch throughput. Choosing the right probe design for each workload means the difference between catching regional degradation in real time and discovering it through a support ticket.
TL;DR
- Chat and embeddings endpoints have fundamentally different latency profiles: chat measures TTFB and streaming duration; embeddings measure synchronous batch latency and throughput.
- Probe design must match the workload: synthetic chat probes should use streaming clients and report percentile TTFB; embeddings probes should test batch sizes matching production traffic.
- Regional variance in latency is typical and significant (50–300% variation from baseline); daily probes across 21 regions surface provider and routing issues before they impact users.
- Set separate SLOs for each endpoint type: chat targets TTFB under 500 ms (p95) from each region; embeddings targets total batch latency under 1–2 seconds depending on batch size.
- Use Observinio alerts to detect degradation patterns and correlate latency shifts with provider maintenance windows or routing changes.
Key Takeaway
Setting up region-specific SLOs and matching probe design to your endpoint type—TTFB for chat, batch latency for embeddings—is essential for catching degradation before users experience it in production.Why Chat and Embeddings Need Different Probes
Chat completion endpoints (like OpenAI's /chat/completions) are designed for streaming. The user sees tokens arrive incrementally, which improves perceived latency and engagement. From a monitoring perspective, this means your first measurement point, TTFB, happens when the model generates the first token, not when the full response is ready. A 5-second chat completion might report a 150 ms TTFB, which is excellent, but total duration matters for backend cost and queue time.
Embeddings endpoints (like OpenAI's /embeddings) are synchronous and batch-oriented. You send a batch of texts or documents, wait for the full response, then use the vectors. There is no streaming. Your probe measures the wall-clock time from request to response, with no intermediate tokens to track. The relevant metrics are latency percentiles and throughput (vectors per second), not token-per-second streaming rates.
This distinction matters because it changes what you should monitor and how you interpret results:
- Chat probes need to consume the streaming response to measure TTFB accurately. If you ping the endpoint and close the connection before reading the first token, you miss the actual user experience.
- Embeddings probes need realistic batch sizes. Testing with batch size 1 tells you nothing about how your production system will behave with batch 100; latency and throughput scale nonlinearly.
- Alert thresholds differ: a 1-second TTFB is a problem for chat; it is irrelevant for embeddings if the total batch latency is 200 ms.
Designing Chat Probes: Focus on TTFB and Streaming Behavior
A good chat probe simulates real user traffic by opening a streaming connection, sending a prompt, and recording the latency of the first and last tokens. Here is what you should measure:
Time-to-First-Byte (TTFB): The interval from request sent to the first token received. This is what users feel when they type and wait for the model to "think." Most users notice TTFB above 1 second; above 2 seconds, they assume the service is broken. A healthy TTFB is under 500 ms for most providers and regions.
Time-to-Full-Completion (TTFC): The total duration from request to the final token. This matters for backend cost, queue management, and overall throughput. A 5-second TTFC with 150 ms TTFB tells you the model is generating tokens at a reasonable rate (roughly 40 tokens/second).
Token throughput: Once you have TTFB and TTFC, calculate output tokens per second. This exposes whether a slower endpoint is due to model latency or token generation speed. A model generating fewer than 20 tokens/second in production may indicate a bottleneck.
Practical Chat Probe Setup
Your chat probe should:
- Use a streaming-aware HTTP client (e.g.,
requests.Response.iter_lines()in Python, or native streaming in Node.js). - Send a fixed, realistic prompt (e.g., "Explain quantum computing in one sentence.").
- Measure the timestamp of the first and last tokens.
- Test from multiple regions (Observinio monitors 21 regions, which gives you global coverage without building your own infrastructure).
- Run daily or every 6 hours to catch degradation before users do.
- Report TTFB as a percentile distribution, not just an average, p50, p95, and p99 tell you about tail latency.
- TTFB (p50, p95, p99)
- TTFC (p50, p95, p99)
- Output tokens per second (average)
- Request status and error rate
- Endpoint (OpenAI direct, OpenRouter, or other provider)
- Region (US East, EU West, Asia Pacific, etc.)
- Timestamp
Designing Embeddings Probes: Test Real Batch Sizes
Embeddings endpoints behave differently because they are synchronous and batched. Your probe design must reflect production usage patterns.
Batch size: Most production systems embed texts in batches of 10–500, depending on throughput requirements and latency SLOs. Testing batch size 1 is unrealistic. Instead, probe with batch sizes that match your actual workload: if you embed 100 documents at a time, your probe should too. Latency is sublinear with batch size (i.e., 100 texts don't take 100× longer than 1 text), so batch size heavily affects the latency profile.
Vector dimensions: Different embedding models return different vector sizes (e.g., 768 for sentence-transformers, 1536 for OpenAI's text-embedding-3-small). This affects data transfer time, especially from distant regions. Always include the correct model and dimensions in your probe.
Latency and throughput: Measure total request latency (request sent to full response received), then divide by batch size to get per-text latency. Compare this against your SLO. If you need to embed 1000 documents per second and your latency is 2 seconds per 100-document batch, you will need parallel workers.
Practical Embeddings Probe Setup
Your embeddings probe should:
- Use your production batch size (or a reasonable representative size, e.g., 100).
- Send realistic texts (a mix of short snippets and longer documents, if applicable).
- Measure end-to-end latency in milliseconds.
- Calculate vectors per second: (batch_size / latency_ms) 1000.
- Test from the same regions as your chat probes for consistency.
- Run daily to detect throughput regressions.
"The real engineering work is quality evaluation, latency/cost tuning, index choice (HNSW/IVF/PQ), and governance (ACLs, PII).">, Medium
Example metrics to collect:
- Total request latency (p50, p95, p99)
- Vectors per second (throughput)
- Batch size
- Model name and dimensions
- Request status and error rate
- Endpoint (OpenAI direct, OpenRouter, other)
- Region
- Timestamp
Regional Variance: Expect It, Plan for It

One of the most common surprises in production monitoring is regional latency variance. A chat endpoint that returns 150 ms TTFB from US East might take 400–600 ms from Europe or Asia Pacific. This is not necessarily a problem, geographic distance and routing paths are real, but it is critical to know your baseline and alert when it shifts.
Common Causes of Regional Variance
- Network path: Packets travel different routes depending on where your probe originates. A path through more hops or congested international links will add latency.
- Provider infrastructure: Some providers cache or serve traffic from regional edge nodes. If an endpoint is primarily hosted in the US, requests from Asia will always be slower.
- Time-of-day patterns: Peak hours in one region may coincide with off-peak in another, affecting queuing and response time.
- Routing and CDN: If you use OpenRouter or a similar aggregator, latency depends on their routing logic and which downstream provider they select.
Setting Region-Specific SLOs
Instead of a single global SLO, define per-region thresholds. For example:
| Region | Chat TTFB Target (p95) | Embeddings Latency Target (p95) |
|---|---|---|
| US East | 300 ms | 500 ms |
| US West | 350 ms | 550 ms |
| EU West | 400 ms | 700 ms |
| Asia Pacific | 500 ms | 1000 ms |
Probe Configuration Workflow
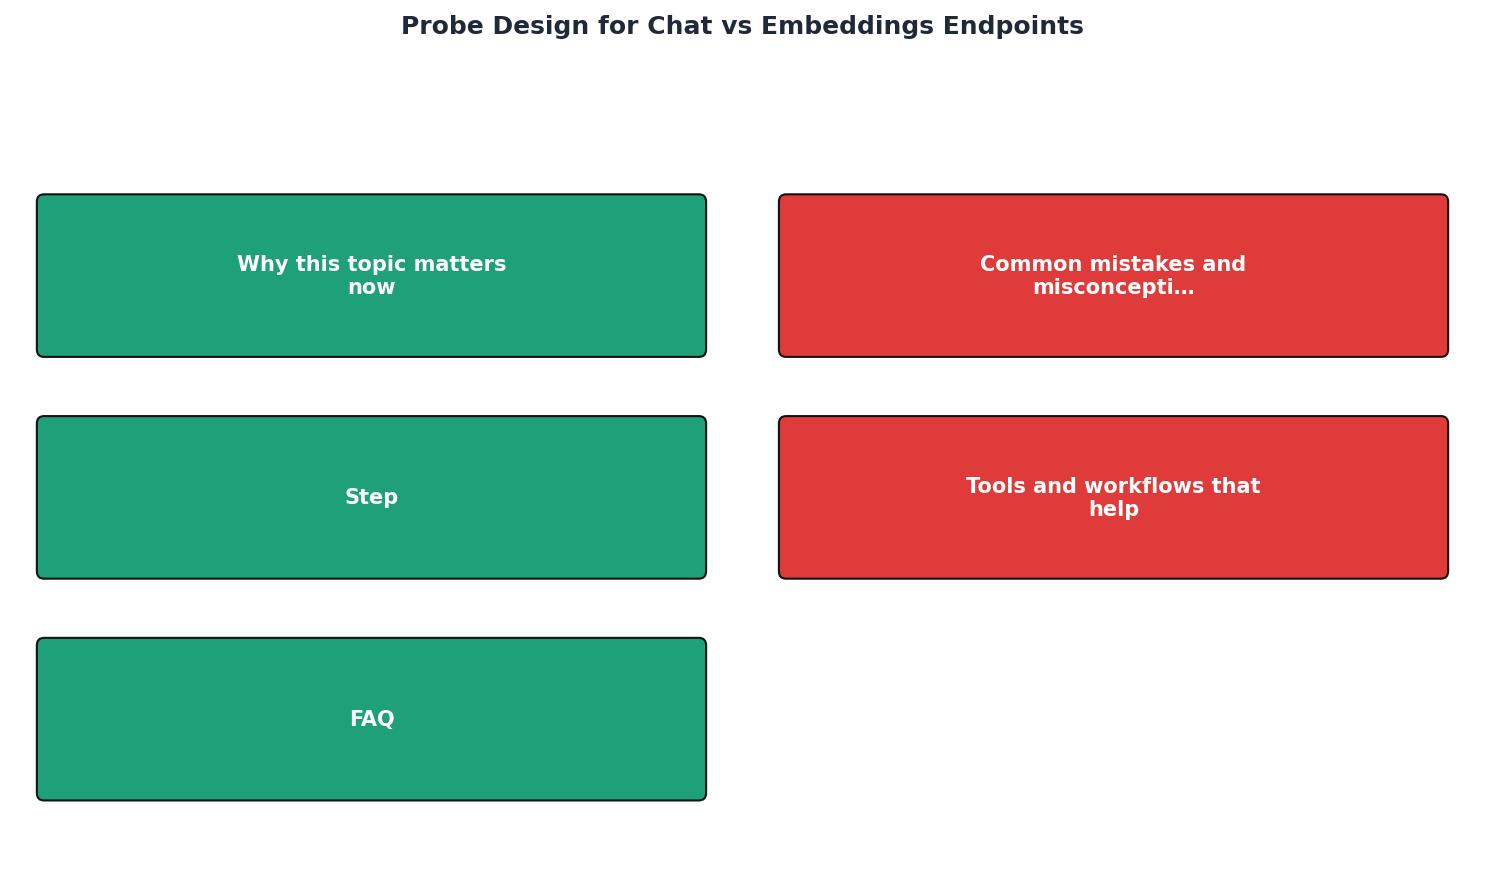
Here is a step-by-step workflow to set up probes for both endpoint types:
Your progress is saved automatically in your browser.
- Identify your endpoints: List all chat and embeddings endpoints you depend on (e.g., OpenAI direct, OpenRouter with OpenAI, Anthropic via OpenRouter).
- Choose realistic test payloads: For chat, use a fixed prompt that represents your typical queries. For embeddings, use a batch of realistic texts or documents.
- Define SLOs: Based on your users' expectations and geographic distribution, set TTFB targets for chat and latency targets for embeddings, per region.
- Configure probes in Observinio: Select each endpoint, specify chat or embeddings mode, set the test payload, batch size (for embeddings), and regions.
- Set alert thresholds: Define percentile targets (p95, p99) and absolute thresholds (e.g., alert if TTFB > 1000 ms in any region for 5 minutes).
- Collect baselines: Run probes for 1–2 weeks to establish normal variance. This helps avoid alert fatigue and identifies outliers.
- Review and iterate: Weekly, check latency trends and degradation patterns. Adjust SLOs if needed based on user impact or provider changes.
Comparing Providers and Routing Decisions
One of the most valuable uses of probe data is provider comparison. If you route chat requests through OpenRouter, you might want to know: "How does OpenRouter's aggregate latency compare to OpenAI direct?" or "Which OpenRouter upstream provider is fastest for my region?"
Observinio's provider-specific probes make this comparison straightforward. You can:
- Run identical probes against OpenAI and OpenRouter and overlay the results.
- Detect when a provider degrades and automatically trigger a failover.
- Measure the overhead of aggregators (OpenRouter vs direct) to inform cost-vs-speed tradeoffs.
- Identify which upstream provider OpenRouter selects for a given request (if using consistent routing).
FAQ
Frequently Asked Questions
Start Monitoring Today
Regional latency variance and endpoint-specific performance are not abstract problems, they directly affect user experience and your platform's reliability. Whether you ship chat completions or embeddings at scale, synthetic probes in 21 regions give you the early warning system that support tickets cannot provide.
Set up daily probes for your chat and embeddings endpoints using Observinio's region-based monitoring. Define per-region SLOs, configure degradation alerts, and integrate results into your incident response workflow. You'll catch slowdowns before your users do and make data-driven routing decisions that balance cost and speed. Visit /status to see real-time latency across providers and regions, or contact the team at /contact to set up probes for your infrastructure today.
Additional Resources
- Embeddings in Practice: A Research & Implementation Guide - Embeddings turn unstructured data into vectors that enable semantic retrieval for search, recommendations, and RAG. Self-host or use region- ...
- Configure a load test for AI Search endpoints - Load testing measures how an AI Search endpoint performs under traffic so you can confirm its production readiness before you deploy.
- Get multimodal embeddings | Gemini Enterprise Agent ... - Learn how to generate multimodal embeddings using Gemini Enterprise Agent Platform models for image, text, and video data.