
Photo by cottonbro studio from Pexels
OpenRouter gives you a single API gateway to dozens of LLM providers, but that convenience comes with a trade-off: one more hop between your application and the model, and one more variable when latency spikes. If your product serves users across multiple continents, you need more than a health-check ping, you need continuous, region-aware latency data that tells you exactly where and when performance degrades. This guide walks through a practical setup for monitoring OpenRouter response times, from choosing the right metrics to configuring alerts that fire before your users notice a problem.
TL;DR
- OpenRouter adds a routing layer that can introduce variable latency depending on the upstream provider, model load, and your caller's region.
- Effective monitoring requires tracking TTFB (Time to First Byte) and TTFT (Time to First Token) separately, aggregate averages hide regional problems.
- Synthetic probes from multiple geographic regions give you a baseline that application-side instrumentation alone cannot provide.
- Alerting should trigger on sustained percentile shifts (p95, p99), not single-sample spikes.
- Observinio automates this with daily probes from 21 regions, baseline comparison, and email alerts on degradation.
Why OpenRouter Latency Deserves Its Own Monitoring

When you call an LLM provider directly, say, the OpenAI completions endpoint, the request path is relatively straightforward: your server, the provider's load balancer, and the inference cluster. OpenRouter inserts an intelligent routing layer in between. That layer selects the best upstream provider for your chosen model, applies rate-limit logic, and forwards the request. Most of the time this adds only a few milliseconds of overhead. But under specific conditions, provider failover, model congestion, or geographic misrouting, that overhead can balloon unpredictably.
The core challenge is that OpenRouter's routing decisions are opaque to the caller. You send a request for anthropic/claude-3.5-sonnet and OpenRouter decides which backend serves it. If that backend is experiencing elevated load, your TTFT jumps from 400 ms to 1,200 ms, and you have no visibility into why unless you are actively measuring from the outside.
The metrics that matter
Not all latency numbers are equally useful. Here is what to track and why:
- TTFB (Time to First Byte): Measures how long until the first byte of the HTTP response arrives. This captures DNS resolution, TCP/TLS handshake, OpenRouter's routing decision, and the upstream provider's queue time. A TTFB spike usually points to infrastructure or routing issues rather than model inference speed.
- TTFT (Time to First Token): For streaming completions, this is the delay until the first actual token appears in the SSE stream. TTFT includes everything in TTFB plus the model's initial inference pass. A TTFT increase with stable TTFB suggests the model or provider is under load.
- Total response time: End-to-end wall-clock time for the full completion. Useful for non-streaming use cases and for tracking throughput regressions.
- Regional variance: The difference in any of the above metrics when measured from Frankfurt versus Tokyo versus São Paulo. A 200 ms gap between regions might be acceptable; a 900 ms gap usually means something is misconfigured or a regional endpoint is degraded.
Setting Up Synthetic Probes for OpenRouter

Application-side instrumentation (logging latency in your own API handlers) is necessary but insufficient. It only tells you what your servers experience from their specific cloud region. If your backend runs in us-east-1 but your users are in Southeast Asia, you are blind to the latency they actually feel. Synthetic probes solve this by making standardized requests from known geographic locations at regular intervals.
Step-by-step: configuring multi-region probes
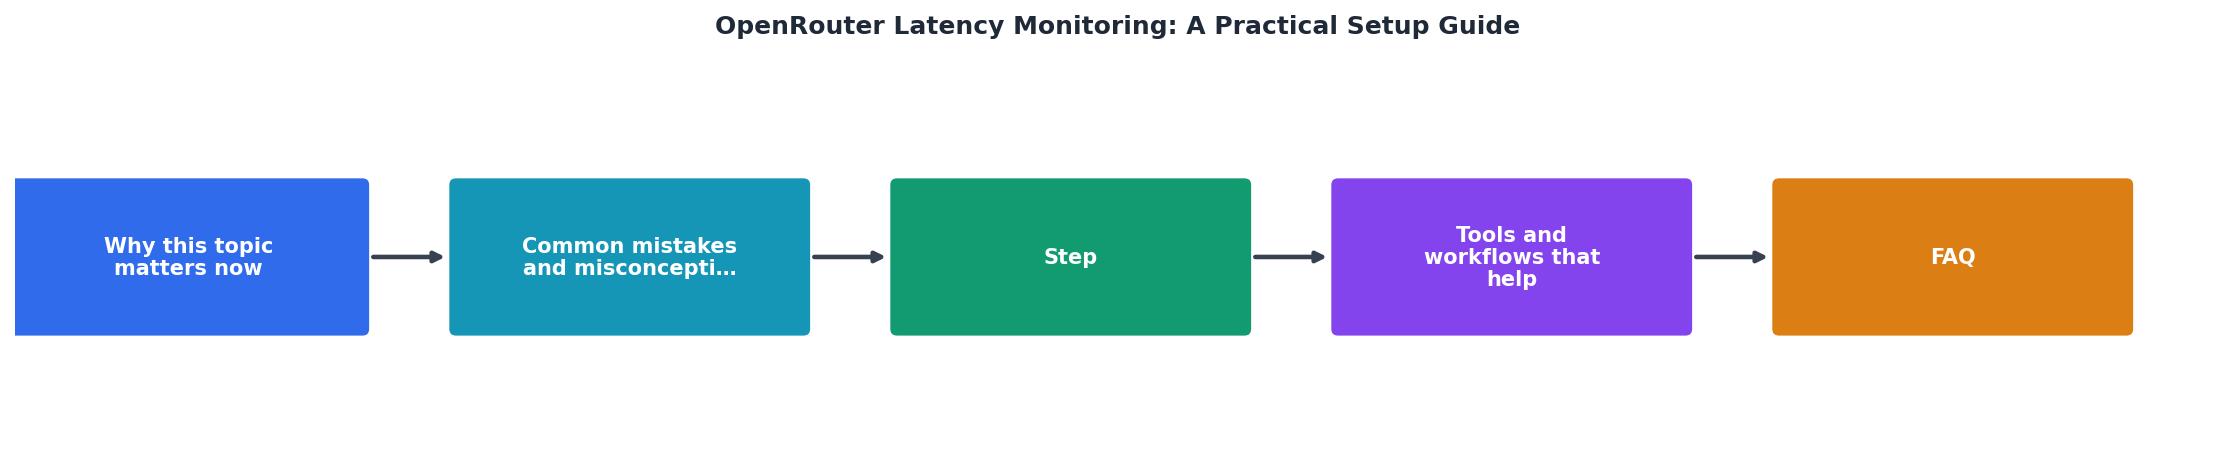
Follow these steps to build a monitoring baseline for your OpenRouter usage:
- Identify your critical models. List every model you call through OpenRouter in production. Prioritize by traffic volume. If 80 % of your requests go to
openai/gpt-4oandanthropic/claude-3.5-sonnet, those are your primary probe targets.
- Select probe regions that match your user base. Check your application analytics to find where users concentrate. At minimum, cover North America (east and west coast), Western Europe, and one Asia-Pacific region. If you serve Latin America or the Middle East, add those as well.
- Define a standardized probe payload. Use a short, deterministic prompt that produces a predictable token count. This removes output variability from your measurements. For example:
   {
     "model": "openai/gpt-4o",
     "messages": [
       {"role": "user", "content": "Respond with exactly five words: 'Latency probe response received successfully.'"}
     ],
     "max_tokens": 10,
     "temperature": 0
   }
Keep max_tokens low and temperature at zero so every probe produces nearly identical load on the provider. This makes your latency data comparable across runs.
- Set probe frequency. For baseline establishment, run probes every hour for the first two weeks. Once you have a stable baseline, daily probes are sufficient for trend detection. More frequent probes burn API credits without adding proportional insight.
- Record TTFB and TTFT separately. If you are building custom probes, use streaming mode and timestamp the first SSE
data:event independently from the initial HTTP response headers. Store both values alongside the probe region, model, and UTC timestamp.
- Establish baselines per region and model. After two weeks of data, compute p50, p95, and p99 for each region-model pair. These become your reference points. Any sustained deviation above the p95 baseline warrants investigation; crossing p99 should trigger an alert.
- Configure degradation alerts. Set thresholds relative to your baselines, not absolute millisecond values. A 500 ms TTFT is excellent for a 70B-parameter model but terrible for a small routing model. Percentage-based thresholds (e.g., "alert when p95 exceeds baseline by 40 % for three consecutive probes") adapt to each model's normal performance profile.
"The OpenRouter Dashboard Template provides ready-made visualizations for monitoring OpenRouter usage.">, OpenRouter Observability: Trace LLM Requests
While dashboard templates are a good starting point for visualizing usage patterns, they typically lack the multi-region synthetic probing that catches latency regressions before they affect production traffic. Combining usage dashboards with external probes gives you both the "what happened" and the "where it happened" perspectives.
Interpreting Latency Data and Acting on Alerts

Collecting data is only half the job. The real value comes from having a repeatable process for responding to what the data shows. Below is a practical checklist for triaging a latency alert on OpenRouter.
Latency alert triage checklist
Your progress is saved automatically in your browser.
Common patterns and what they mean
| Pattern | Likely cause | Recommended action |
|---|---|---|
| TTFT spike in one region, others normal | Regional provider capacity issue | Monitor; consider geo-routing fallback |
| TTFB spike globally, TTFT proportional | OpenRouter infrastructure issue | Check OpenRouter status; prepare failover |
| Gradual TTFT increase over days | Model popularity growth or provider throttling | Re-evaluate model choice; test alternatives |
| Intermittent spikes at same time daily | Provider maintenance windows or batch job interference | Shift probe schedule to confirm; adjust traffic routing during window |
Building a Long-Term Latency Baseline
Monitoring is not a one-time setup. Provider performance shifts over weeks and months as models get updated, infrastructure scales, and traffic patterns change. A robust monitoring practice includes weekly reviews of your latency baselines.
Key activities for your weekly review:
- Compare this week's p50 and p95 against the previous four weeks. Look for upward trends that have not yet triggered alerts but indicate gradual degradation.
- Check for new models or provider changes. OpenRouter frequently adds new providers and models. If you switched models or OpenRouter changed upstream routing, your baselines need recalibration.
- Review alert noise. If you received more than two false-positive alerts in a week, your thresholds are too tight. Adjust them upward by 10 % and re-evaluate the following week.
- Archive incident timelines. Every confirmed latency incident should be logged with timestamps, affected regions, root cause (if known), and resolution. This archive becomes invaluable during quarterly provider reviews.
Frequently Asked Questions
Start Monitoring OpenRouter Latency Today
Ready to monitor OpenRouter latency from 21 global regions?
Observinio runs daily synthetic probes, computes rolling baselines, and alerts you by email when performance degrades — no infrastructure setup required.
View OpenRouter Monitoring DashboardIf setting up and maintaining multi-region probes, baseline calculations, and alert thresholds sounds like more infrastructure work than you want to take on, Observinio handles it out of the box. Daily synthetic probes from 21 global regions measure TTFB and TTFT for OpenRouter models, compare results against rolling baselines, and send you email alerts when latency degrades in any region. Check the live status page to see current OpenRouter performance data, or get in touch to start receiving weekly latency summaries for the models your product depends on.
Additional Resources
- OpenRouter Observability: Trace LLM Requests - This guide walks you through setting up OpenRouter monitoring using OpenTelemetry and exporting traces to SigNoz, so you can track requests, ...
- Broadcast - Send Traces to Observability Platforms - Navigate to Settings > Observability in your OpenRouter dashboard · Toggle the “Enable Broadcast” switch to turn on the feature · Add one or more destinations ...
- Latency and Performance | Minimizing Gateway ... - OpenRouter is designed with performance as a top priority. OpenRouter is heavily optimized to add as little latency as possible to your requests.