

Photo by Jonathan Santiago from Pexels
OpenAI API latency can make or break your user experience. A chat interface that takes 2 seconds to show the first token feels snappy; one that takes 10 seconds feels broken. But knowing whether your latency is "normal" requires understanding what you're actually measuring, and where regional variance can blindside you. This guide maps out the metrics that matter, establishes realistic baselines, and shows you how to spot genuine problems before your users do.
TL;DR
- TTFB (time to first byte) under 500 ms is healthy for most chat use cases; TTFT (time to first token) typically adds 100–300 ms on top of that depending on model and region.
- Regional variance is real: OpenAI responses from Europe or Asia can be 2–3× slower than US requests, even for the same model and payload.
- Baseline shift matters more than absolute numbers: A spike from your normal 800 ms to 1200 ms is a red flag, even if 1200 ms is still acceptable in isolation.
- Provider degradation is often regional and silent: You won't see it in aggregate averages; daily multi-region probes catch it before customers complain.
- Track both TTFB and token generation time separately: TTFB tells you about network and backend latency; token generation time reveals model congestion or complexity issues.
Understanding Latency Metrics

When you call the OpenAI API, your request travels through multiple stages. Each stage contributes to perceived latency, and conflating them blinds you to real problems.
Time to First Byte (TTFB) measures the elapsed time from sending your request until the first byte of response arrives. This includes DNS resolution, TLS handshake, backend processing, and the distance from OpenAI's server to your client. TTFB is dominated by network topology and backend capacity.
Time to First Token (TTFT) (sometimes called "time to first meaningful response" or TTMT) measures the time until the API returns the first actual token in the stream. For streaming responses, this is where your user sees the first word appear on their screen. TTFT = TTFB + tokenization + model scheduling. If TTFB is 300 ms but TTFT is 800 ms, the model is queued or the inference pipeline is saturated.
Token Generation Rate (tokens per second after the first token) tells you whether the model is consistently fast or if it bogs down mid-response. A degrading rate signals congestion or resource exhaustion.
In practice:- Chat interfaces: You care most about TTFT because users perceive the delay until text appears.
- Batch or async workflows: TTFB is less critical; total end-to-end time matters more.
- SLOs and alerts: Track both TTFB and TTFT separately so you can distinguish network problems from backend saturation.
Normal Latency Baselines
Establishing a baseline is essential because "normal" is contextual. A request from a US East server to OpenAI's closest endpoint might see 150–250 ms TTFB; the same request from Tokyo might see 400–600 ms. Both are normal, the difference is geography, not a problem.
US-Based Requests
For clients or servers in the US (especially East Coast), expect:
- TTFB: 100–300 ms (most common: 150–200 ms)
- TTFT: 200–500 ms (depends on model; GPT-4 is typically slower than GPT-3.5)
- Token rate: 50–100 tokens/sec (varies by model; check your prompt length and completion length)
Europe-Based Requests
From Western Europe (UK, Germany, France):
- TTFB: 250–450 ms
- TTFT: 350–700 ms
- Token rate: 40–80 tokens/sec (slightly reduced due to intercontinental routing)
Asia-Pacific Requests
From Singapore, Tokyo, or Sydney:
- TTFB: 400–700 ms
- TTFT: 600–1000+ ms
- Token rate: 30–60 tokens/sec
"The problem is that it wipes out filler words.">, How to overcome latency in response
Identifying Real Problems
Raw latency numbers are noise without context. A 1-second TTFB is catastrophic if your baseline is 150 ms, but unremarkable if your baseline is 900 ms. Watch for these warning signs:
Percentage Increase Over Baseline
If your 95th-percentile TTFB is normally 300 ms but suddenly jumps to 600 ms or more, that's a 2× regression. Even if 600 ms is still "acceptable," it signals real degradation. Set alerts at 30–40% above your rolling 7-day median to catch issues early.
Regional Asymmetry
Your US TTFB is fine, but Europe is seeing 800+ ms TTFB while it normally sits at 400 ms. This pattern points to regional outage, regional routing change, or regional ISP congestion. Aggregate alerts mask this; regional probes expose it.
Diverging TTFB and TTFT
If TTFB is normal but TTFT is suddenly 2–3× higher, the backend is struggling to schedule inference. This happens during traffic spikes or when OpenAI deploys model changes. It's not a network problem; it's a queue problem, and you can't fix it by retrying faster.
Consistent Tail Latency (99th Percentile)
If your p99 TTFB is consistently 2–3× your p50, check whether you're hitting rate limits, account throttling, or whether your request mix has changed (e.g., longer prompts, more complex tasks). Rate limit headers in OpenAI responses reveal this.
Monitoring Across Regions
Your progress is saved automatically in your browser.

Regional latency variance is the hidden killer. If your dashboard only shows global average TTFB, you miss half the story. A provider might degrade in one region while another sees no change, and your customers in that region churn while your metrics look fine.
Set up synthetic probes from at least 3–5 geographic regions:
- US East (Virginia or Ohio)
- US West (California or Oregon)
- Western Europe (Ireland, Germany, or UK)
- APAC (Singapore, Tokyo, or Sydney)
- Optional: South America or Middle East (if you serve those regions)
Step-by-Step Regional Monitoring Setup
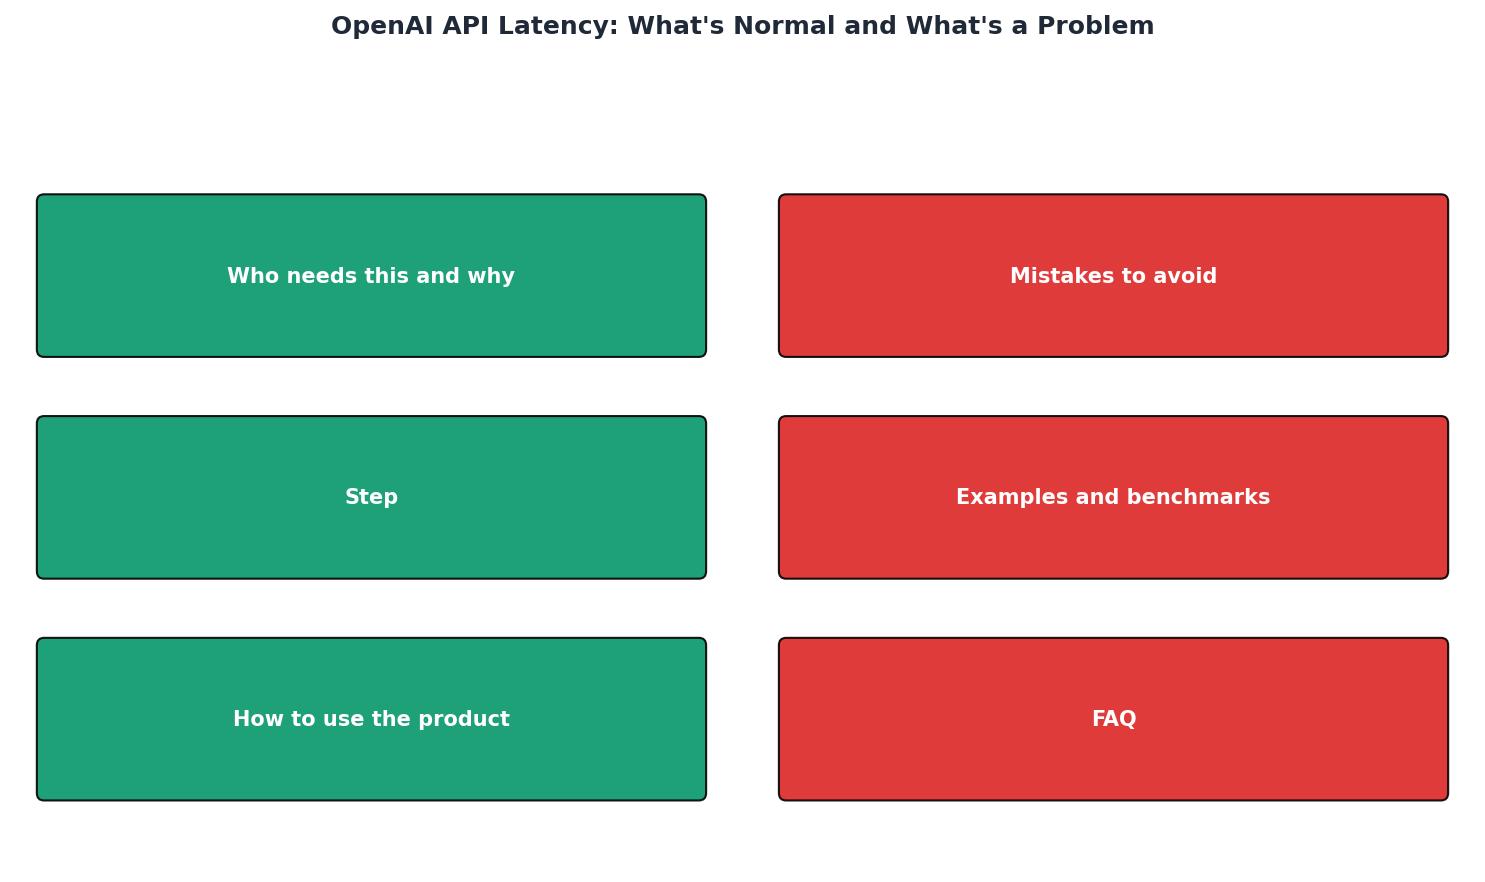
- Define your key regions: Prioritize regions where your users or servers are concentrated.
- Choose a probe interval: 5–10 minutes balances freshness and API quota usage. Adjust if you detect too much noise or miss incidents.
- Set baseline reference: Run uninterrupted probes for 7–14 days to establish normal TTFB, TTFT, and token rate for each region.
- Configure alerts: Set thresholds at +30% to +50% above the rolling 7-day median. Avoid fixed thresholds (e.g., "alert if TTFB > 500 ms") because regional baselines differ.
- Correlate with incidents: When an alert fires, note the time, region, and whether TTFB or TTFT spiked. This pattern guides your response.
- Review weekly trends: Weekly summaries reveal creeping degradation (e.g., token rate declining week-over-week) that daily spikes might miss.
Troubleshooting High Latency
When latency degrades, follow this diagnostic tree:
Is it TTFB or TTFT?
- High TTFB (>500 ms US, >800 ms Europe): Network or backend routing issue. Check OpenAI status page, your ISP peering, and DNS resolution time. If regional, likely provider infrastructure issue.
- Normal TTFB, high TTFT: Model queue or inference bottleneck. Retry later or reduce batch size. OpenAI may be under load.
Is it regional?
- One region only: Likely regional ISP issue, OpenAI regional outage, or your own regional infra problem.
- All regions equally: Global OpenAI issue or your own upstream network problem.
- Multiple regions, different magnitude: Suggests a "slowly degrading" scenario, OpenAI may be adding latency gradually across regions.
Is it correlated with your request pattern?
- Latency spike when you increase request volume: You're hitting rate limits or account throttling. Reduce QPS or contact OpenAI for higher limits.
- Latency spike when you change prompt length or model: The new workload may be computationally harder. This is expected; baseline your new pattern for comparison.
Check OpenAI Status Page and Rate Limits
Visit status.openai.com for reported incidents. Also inspect response headers for x-ratelimit-remaining-requests and x-ratelimit-reset-requests; if these are low, you're being throttled.
Latency SLOs for Production
Define SLOs that tie latency to user experience and business goals:
- Chat interfaces: TTFT ≤ 1 second at p95, across all regions where you operate.
- Analytics or summarization: TTFB ≤ 500 ms at p95 (users expect slower batch responses).
- Real-time systems (search augmentation): TTFB ≤ 200 ms at p95; token rate ≥ 50 tokens/sec at p50.
FAQ
Frequently Asked Questions
Keep Your Latency Observable
🎯 Observinio Regional Monitoring
Observinio automatically monitors OpenAI API latency from 21 geographic regions with 5–10 minute probe intervals, baseline history tracking, and adaptive alerting. Detect regional degradation before customers do and establish region-specific SLOs that reflect actual geography-based performance variance.
Benefit: Catch latency anomalies 2–4 hours earlier than users report them, and isolate regional issues that aggregate metrics hide.
Latency is a leading indicator of problems. A 40% jump in TTFB from one day to the next often precedes outages or customer complaints by hours. Setting up multi-region probes from your infrastructure (or using a service like Observinio that covers 21 regions) means you'll spot these trends early and can investigate before they become incidents.
Start by establishing baselines in your key regions, set degradation alerts at 30–50% above the rolling median, and review weekly trends alongside incident logs. Over time, you'll develop a clear picture of what's normal for your workload and where to look when things go wrong. Implementing these practices ensures that latency regressions are caught within hours rather than days, keeping your user experience consistently responsive across all regions.
Additional Resources
- How to overcome latency in response - API - If we use 1 second delay then it takes a while for the user to hear a response because this text needs to be fed to OpenAI to respond and ...
- I am sending request to open ai function calling and it is ... - 'm experiencing a consistent latency issue with the OpenAI API where many requests take 20–30+ seconds to complete, even after several ...
- Severe Latency Spike / Timeouts with Flagship Models ... - Same for us - latency on the Responses API is extreme, and API calls seem to be silently stalling. We also have 900 sec time out on our ...