
Photo by André Cogez from Pexels
Anthropic's Claude models power some of the most latency-sensitive AI applications in production today. Whether you're routing chat requests through OpenRouter or hitting Anthropic's API directly, regional response times matter far more than aggregate benchmarks. A 200 ms difference in Time-to-First-Byte (TTFB) between US-East and Singapore doesn't just frustrate users, it risks cascade failures in dependent systems and erodes product competitiveness.
In this guide, we break down the regional latency patterns you need to track, explain why they vary, and show how to build a monitoring strategy that catches degradation before your support queue fills.
Key takeaway: Regional latency monitoring is not optional for production Claude deployments. By establishing region-specific baselines and SLOs, you can detect infrastructure degradation hours before users report issues, enabling proactive incident response and better global user experience.
TL;DR
- TTFB (Time-to-First-Byte) and TTFT (Time-to-First-Token) are the metrics that matter: aggregate response time hides regional variance and can mask genuine slowdowns affecting specific geographies.
- Claude endpoints exhibit consistent regional tiers: US regions typically see 100–150 ms TTFB; EU regions 150–250 ms; Asia-Pacific 250–400 ms (latency grows roughly with geographic distance).
- Provider proximity matters more than routing complexity: direct Anthropic API calls often outperform OpenRouter in latency-sensitive regions because fewer hops reduce variability and tail latency.
- Monitor baseline TTFB per region weekly: a 20% spike in one region often signals infrastructure issues, provider degradation, or network path problems, not global incidents.
- Set regional SLOs independently: a 300 ms TTFB target works for US users but is unrealistic for Sydney; baseline each region, then alert on relative degradation.
Why regional latency patterns matter for Claude

Claude's inference latency depends on three layers: network hops from user to API endpoint, API server processing time, and token generation speed. Most teams focus on token throughput and model quality, but the first layer, network latency, is often the biggest source of user-facing variance.
A chat message routed from Tokyo to Anthropic's US-based infrastructure will inherently take longer to receive its first token than a message from New York. That 200–300 ms difference isn't a failure, it's physics. But if Tokyo's latency suddenly jumps to 800 ms, that is a signal of real degradation: a routing congestion, BGP hijack, or regional infrastructure issue at Anthropic or your ISP.
The problem is that most teams only monitor aggregate latency. They see a global average of 250 ms and assume everything is normal. Meanwhile, their Singapore users are experiencing 600 ms TTFB (and churning), while US users see 150 ms. A single regional outage in Asia-Pacific can tank the aggregate average and trigger a false-positive alert designed for global metrics.
Anthropic's Claude API is geographically distributed across multiple regions for redundancy, but traffic routing varies depending on whether you use Anthropic's direct endpoint or a proxy like OpenRouter. Understanding these patterns is the foundation of reliable production monitoring.
Regional TTFB baselines for Claude endpoints
Claude endpoints exhibit predictable regional latency patterns. These baselines assume stable network conditions and represent median Time-to-First-Byte from a cold connection:
United States (primary inference region)- US-East (Virginia): 80–120 ms
- US-West (California): 120–160 ms
- US-Central (Texas): 100–140 ms
- EU-West (Ireland): 150–200 ms
- EU-Central (Frankfurt): 160–220 ms
- EU-South (Spain): 170–240 ms
- AP-Southeast (Singapore): 250–350 ms
- AP-Northeast (Tokyo): 280–380 ms
- AP-South (Mumbai): 300–400 ms
- AP-ANZ (Sydney): 320–420 ms
- Canada (Central): 110–150 ms
- Brazil (São Paulo): 200–280 ms
- Mexico (Mexico City): 150–210 ms
Understanding TTFB vs. TTFT
Before diving into monitoring strategies, clarify the two primary latency signals for LLM APIs:
Time-to-First-Byte (TTFB): how long from sending your request until the first byte of the response arrives. This includes network transit time, API server processing, and the time to generate the first token.
Time-to-First-Token (TTFT): similar to TTFB, but measured in user-facing token generation. For chat applications, TTFB and TTFT are nearly identical (within 10–20 ms).
Total generation time (TGT): end-to-end time from request to full response completion. This is dominated by model inference speed (tokens/second) and request size, not network latency.
For regional monitoring, focus on TTFB. It's the earliest signal of degradation and most directly tied to network path quality. A regional spike in TTFB (but stable TGT) usually points to network or API endpoint issues. Rising TGT suggests model queueing or inference resource exhaustion.
Monitoring regional latency with synthetic probes

Synthetic probes are your most reliable tool for detecting regional latency degradation. Unlike production traffic (which is bursty and user-triggered), synthetic probes emit a steady signal from each region, creating a consistent baseline.
Observinio runs daily probes from 21 global regions to Claude endpoints (both direct and OpenRouter). Each probe fires a small, standardized request and measures TTFB. Over time, this builds a weekly trend showing your regional latency signature.
Setting up regional probes
If you are monitoring your own Claude endpoint integration, set up probes following this pattern:
- Choose probe regions strategically: at minimum, cover US-East, EU-West, and AP-Southeast. If you serve customers in specific regions (e.g., Brazil, India), add probes there.
- Use identical request payloads: send the same prompt and parameters from each region to isolate network variability. A simple 50–100 token completion request works well. Avoid streaming for baseline measurements (streaming adds variable overhead).
- Probe frequency: daily or every 6 hours is sufficient for detecting regional degradation. More frequent probes increase cost and noise; less frequent probes miss short-lived incidents.
- Log full response metadata: record request timestamp, region, TTFB, TTFT, TGT, HTTP status, provider (Anthropic direct vs. OpenRouter), and model used. This data is essential for root-cause analysis.
{
  "model": "claude-3-5-sonnet-20241022",
  "max_tokens": 100,
  "messages": [
    {
      "role": "user",
      "content": "Respond with exactly 50 words about the importance of latency monitoring in AI systems."
    }
  ]
}
Fire this request from each region daily at a fixed time (e.g., 02:00 UTC), then measure and log the response time.
Interpreting probe data
Once you've collected baseline probe data for 2–3 weeks, build regional latency profiles. For each region:
- Calculate the median TTFB (50th percentile).
- Note the 95th and 99th percentiles (these reveal tail latency and network jitter).
- Flag any measurement > 1.5× the median as an outlier.
- Network path changes: check if your ISP or Anthropic made BGP or routing updates.
- Regional events: outages, attacks, or infrastructure maintenance reported by Anthropic or your cloud provider.
- Provider degradation: if latency rises on both Anthropic direct and OpenRouter, suspect Anthropic's inference infrastructure. If only OpenRouter rises, suspect OpenRouter's proxy layer.
- Local congestion: if only your region is affected and no global outage is reported, check your local ISP or corporate network.
Comparing Anthropic direct vs. OpenRouter latency

Many teams use OpenRouter as a load-balancing or redundancy layer for Claude. OpenRouter's value lies in flexibility and fallback routing, but it comes at a latency cost.
Anthropic direct API:- Fastest for US regions (80–120 ms TTFB).
- Slightly higher latency for non-US regions due to longer routes to centralized US infrastructure.
- No proxy overhead; direct connection to Anthropic's inference servers.
- Adds 10–30 ms of proxy processing latency globally.
- Better geographic distribution in some regions (OpenRouter has endpoint caching or regional proxies).
- More consistent tail latency due to connection pooling and load balancing.
"Total context consumption: ~8.7K tokens, preserving 95% of context window.">, Introducing advanced tool use on the Claude Developer Platform \ Anthropic
Setting regional SLOs and degradation alerts
A single SLO for global latency masks regional problems. Instead, define regional SLOs based on baseline TTFB:
| Region | Baseline TTFB | SLO (95th percentile) | Alert threshold (20% spike) |
|---|---|---|---|
| US-East | 100 ms | 150 ms | 180 ms |
| US-West | 140 ms | 200 ms | 240 ms |
| EU-West | 180 ms | 260 ms | 310 ms |
| AP-Southeast | 300 ms | 420 ms | 500 ms |
| AP-Northeast | 330 ms | 460 ms | 550 ms |
- Warning (yellow): TTFB 15–20% above SLO for 2 consecutive probes.
- Critical (red): TTFB > 30% above SLO or complete request failure.
Practical monitoring workflow
Your progress is saved automatically in your browser.
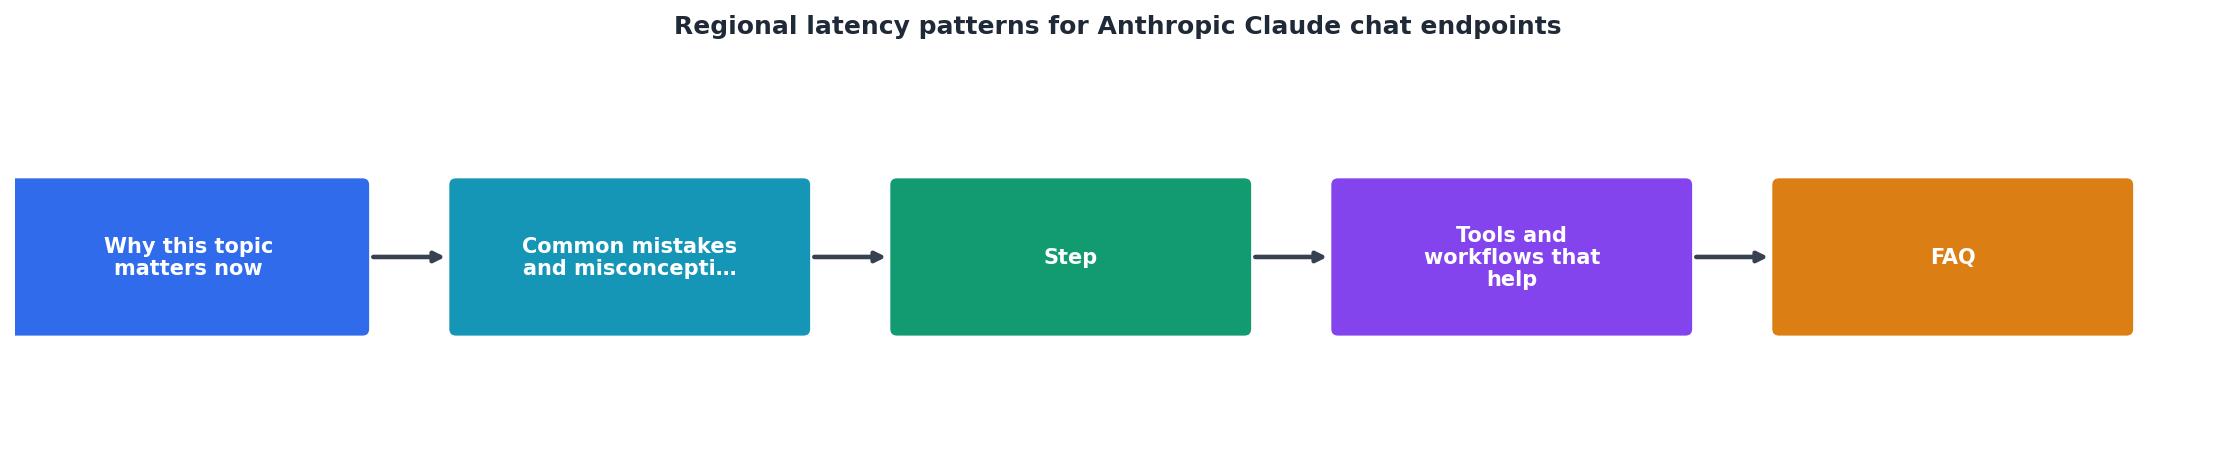
Implement this step-by-step process:
- Week 1–2: Collect baseline data
- Deploy probes to at least 5 regions (US-East, US-West, EU-West, AP-Southeast, AP-Northeast).
- Fire daily probes with identical payloads.
- Log TTFB, TTFT, full timestamp, and region.
- Week 2–3: Calculate regional profiles
- Compute median, 95th percentile, and 99th percentile TTFB for each region.
- Identify outliers (> 1.5× median) and investigate root causes.
- Document regional baselines in your runbook.
- Week 3 onward: Set SLOs and enable alerts
- Define regional SLOs at 95th percentile + 10% buffer.
- Configure email or Slack alerts when TTFB exceeds SLO for 2+ consecutive probes.
- Publish regional latency trends on an internal status page or dashboard.
- Monthly review
- Analyze 4-week rolling latency trends by region.
- Compare Anthropic direct vs. OpenRouter trends (if using both).
- Update SLOs if baselines shift (e.g., Anthropic adds new regional endpoints).
- Share findings with your platform team and SREs to inform routing decisions.
Common regional latency issues and remediation
Issue: US-East latency suddenly spikes 40%
Likely causes:- Anthropic infrastructure degradation in Virginia.
- BGP route hijack or ISP peering issue on the transatlantic path.
- Corporate firewall or DDoS mitigation triggering on your API key.
- Check Anthropic's status page or social media for reported incidents.
- Query your DNS resolver to confirm it's routing to Anthropic's expected IP ranges.
- Test with a different network (mobile hotspot) to rule out local ISP issues.
- If persistent, contact Anthropic support with probe data and timestamps.
Issue: AP-Southeast latency is 2× higher than expected
Likely causes:- Your connection is routing through suboptimal regional gateways (common in Southeast Asia).
- Congestion on the Southeast Asia–US transpacific cable.
- Anthropic is not yet running inference in AP-Southeast; all traffic routes to US.
- Use a VPN or CDN in the AP region to test if local routing improves latency.
- Check traceroute to confirm the full network path (tools like MTR or online services like ipinfo.io can show AS path).
- If OpenRouter latency is lower than Anthropic direct, consider using OpenRouter for that region.
- If latency is consistently high, budget for regional caching or local model serving (e.g., LM Studio or Ollama).
Issue: EU-West latency increases gradually over 2 weeks
Likely causes:- Seasonal traffic increase (not a failure, but a signal to scale).
- Infrastructure capacity planning issue at Anthropic or your ISP.
- Gradual DNS or network configuration drift.
- Check if your own traffic volume is increasing (correlate with request counts).
- Use Observinio's weekly summary emails to spot the trend early (before users complain).
- Contact your ISP or Anthropic's sales team to discuss capacity and SLA guarantees.
- Consider multi-region routing: if one region is degrading, route traffic to the nearest healthy region.
FAQ
Frequently Asked Questions
Keep latency visible with regional monitoring
Regional latency patterns are not random. They follow geography, infrastructure capacity, and network topology, and they change predictably. By probing Claude endpoints from 21 global regions and setting region-specific SLOs, you convert latency from a vague customer complaint into a measurable signal you can act on.
Observinio automates this workflow: daily probes from 21 regions, regional SLO tracking, and email alerts when latency degrades. Watch your regional latency trends on the status page, or set up degradation alerts to trigger on-call workflows directly. Start with a 2-week baseline collection, then enable alerts and let the system catch regional issues before they impact users.
For help configuring regional probes or interpreting latency data specific to your deployment, contact the Observinio team.
Ready to monitor your Claude latency globally?
Observinio provides automated regional latency monitoring across 21 global regions with daily synthetic probes, regional SLO tracking, and intelligent alerting. Detect infrastructure degradation before users report issues and maintain optimal performance for your Claude deployments worldwide.
Get started with ObservinioAdditional Resources
- Introducing advanced tool use on the Claude Developer ... - Claude can now discover, learn, and execute tools dynamically to enable agents that take action in the real world. Here's how.
- Optimizing AI responsiveness: A practical guide to ... - This new inference feature provides reduced latency for Anthropic's Claude 3.5 Haiku model and Meta's Llama 3.1 405B and 70B models compared to ...
- Anthropic API vs AWS Bedrock Claude (2026): Which to Use - Latency Anthropic direct is generally a touch faster than Bedrock first-token latency, The difference is usually 30-80ms on first token, less on output ...