
When your product serves users across multiple continents, a single aggregate latency number tells you almost nothing about the real experience. A chat completion call that resolves in 900 ms from Virginia might take 2.4 seconds from Mumbai, and for users who depend on assistive technologies layered on top of your UI, that extra 1.5 seconds can mean the difference between a usable product and an abandoned session. This article breaks down regional latency patterns for OpenAI chat endpoints and explains how to fold that data into accessibility audits so every user, regardless of geography or ability, gets a responsive experience.
TL;DR
- OpenAI chat endpoint latency varies significantly by region, TTFB differences of 2–5× between US-East and regions like South America, Africa, or South-East Asia are common.
- Accessibility audits that ignore network latency miss a critical dimension: assistive-technology users are disproportionately affected by slow or unpredictable response times.
- Measuring TTFT (Time to First Token) per region gives you a more actionable signal than aggregate P50/P99 numbers.
- Synthetic probes from multiple regions, like the 21-region daily probes Observinio runs, surface patterns that real-user monitoring alone cannot catch consistently.
- Combining regional latency baselines with WCAG timing guidelines lets you set defensible SLOs for AI-powered features.
Why regional latency matters for accessibility

Accessibility is often framed as a front-end concern, color contrast, keyboard navigation, screen-reader labels. But WCAG 2.2 Success Criterion 2.2.1 (Timing Adjustable) and 2.2.3 (No Timing) remind us that time-dependent interactions must accommodate all users. When an AI-powered chat feature streams tokens from OpenAI, the perceived responsiveness is governed by two backend metrics:
- TTFB (Time to First Byte), how long until the server starts responding at all.
- TTFT (Time to First Token), how long until the first meaningful token arrives in a streaming response.
The numbers behind the variance
OpenAI's chat completion infrastructure is concentrated in a small number of Azure data centers, primarily in the US. Requests originating from regions far from those data centers pay a round-trip tax that compounds with model inference time. Consider the following typical pattern observed across synthetic probes:
- US-East (Virginia): TTFT ~0.9–1.3 s
- EU-West (Frankfurt): TTFT ~1.2–1.8 s
- Asia-Pacific (Tokyo): TTFT ~1.6–2.4 s
- South America (São Paulo): TTFT ~2.0–3.0 s
- Africa (Johannesburg): TTFT ~2.5–3.5 s
"Responses: mean=4.268s median=2.349s min=1.421s max=21.711s stdev=4.903sChat : mean=1.354s median=1.298s min=0.902s max=2.385s stdev=0.330s Statistical: Store = False." >, Stateful Responses API Much Slower Than Chat Completions
This community-reported data underscores how much variance exists even within a single endpoint type. When you layer regional network latency on top of that variance, tail-end users can face response times exceeding 20 seconds, well beyond any reasonable accessibility threshold.
Mapping latency to accessibility audit criteria

A thorough accessibility audit for an AI-powered feature should include backend latency as a first-class dimension. Here is how regional latency patterns map to specific audit concerns:
Audit dimensions to evaluate
- Feedback timeliness: Does the UI provide immediate, non-visual feedback (e.g., an ARIA live region announcing "Generating response…") before the first token arrives? If TTFT exceeds 2 seconds in a given region, this becomes critical.
- Timeout behavior: If the chat endpoint takes longer than a configured threshold, does the UI extend the timeout automatically or offer the user a way to extend it? WCAG 2.2.1 requires this for time-limited interactions.
- Streaming vs. blocking: Streaming responses let you deliver partial content early, reducing perceived latency. A blocking implementation forces the user to wait for the entire response, which magnifies regional disadvantages.
- Error recovery: High-latency regions also tend to see more timeouts and retries. Does the UI gracefully communicate failures to assistive technologies, or does it silently fail?
- Consistent experience: If your SLO is "P95 TTFT < 2 s," does that hold in every region you serve, or only in US-East? An SLO that excludes half your user base is not an SLO, it is a regional privilege.
Setting region-aware SLOs
Rather than a single global SLO, consider tiered targets:
| Region tier | Example regions | TTFT SLO (P95) | Rationale |
|---|---|---|---|
| Tier 1 (near-inference) | US-East, US-West | < 1.5 s | Closest to Azure inference clusters |
| Tier 2 (moderate) | EU-West, EU-Central, AP-Northeast | < 2.5 s | One ocean hop, well-peered |
| Tier 3 (distant) | South America, Africa, South-East Asia | < 4.0 s | Multiple hops, less peering |
These tiers let you set realistic expectations while still flagging when a region degrades beyond its baseline. Observinio's baseline comparison feature does exactly this: it learns the normal latency profile for each of its 21 probe regions and alerts you when a region drifts outside its expected range.
How to run a regional latency accessibility audit

Below is a step-by-step process for integrating regional latency data into your accessibility audit workflow.
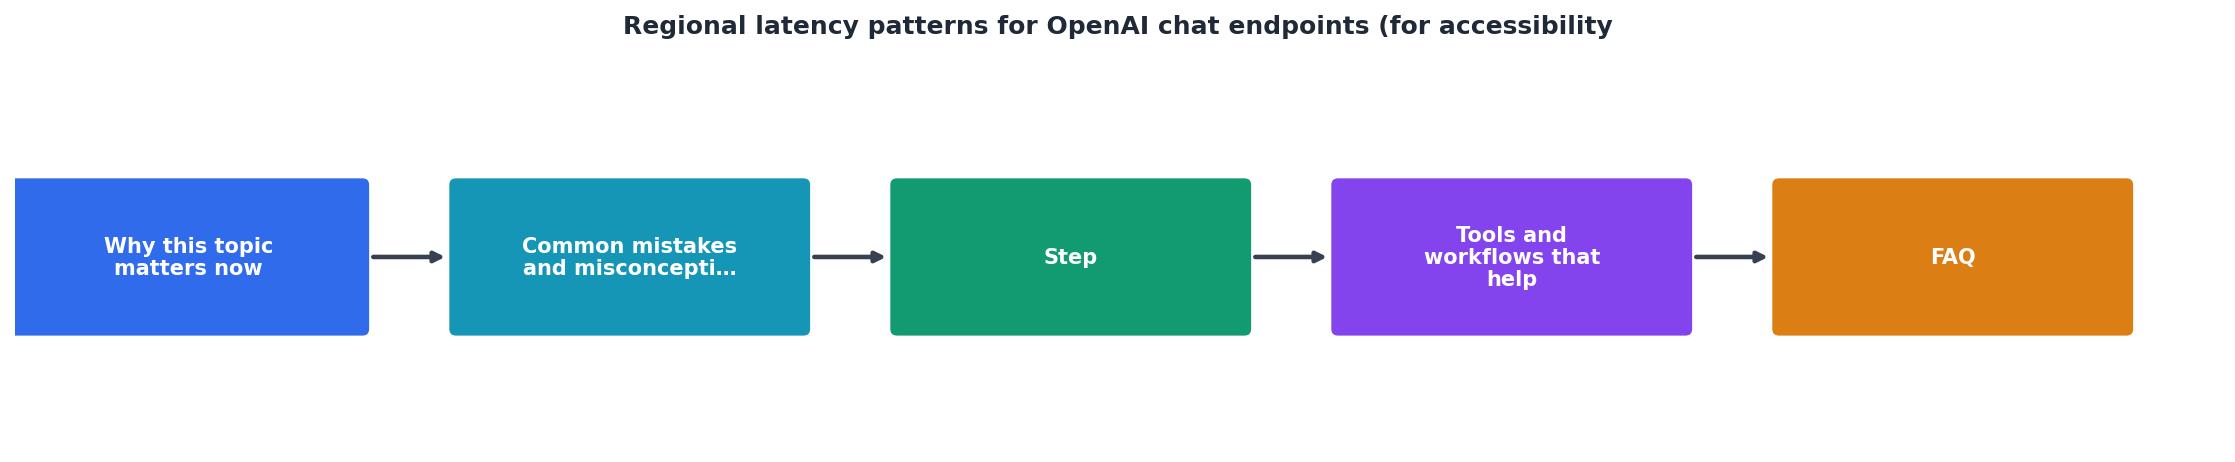
Step-by-step: regional latency accessibility audit
- Inventory your AI-powered features. List every user-facing feature that calls an OpenAI chat endpoint. Note whether each uses streaming or blocking responses.
- Identify your user regions. Pull analytics data to determine where your users actually are. Group them into the tier structure above or create your own based on your traffic distribution.
- Establish regional baselines. Use synthetic probes to measure TTFB and TTFT from each relevant region over at least seven days. Observinio's daily probes across 21 regions can provide this data out of the box, check the status page for current readings.
- Map baselines to WCAG criteria. For each region, compare the measured TTFT against your accessibility requirements. If TTFT P95 exceeds 2 seconds, verify that your UI provides immediate non-visual feedback and supports timeout extension.
- Test with assistive technologies per region. Use a VPN or cloud VM in each target region to test the actual experience with a screen reader (NVDA, VoiceOver) and a switch-access device. Record the time from user action to first audible/visible feedback.
- Document findings per region. Your audit report should include a per-region latency table alongside the standard accessibility checklist. Flag any region where the experience degrades below your SLO.
- Set up continuous monitoring. A one-time audit captures a snapshot. Regional latency patterns shift with provider updates, model changes, and traffic patterns. Configure Observinio degradation alerts to notify you when any region crosses its threshold so your next audit starts with fresh data.
Practical checklist for developers
Use this checklist during implementation to ensure your AI chat feature handles regional latency gracefully:
Your progress is saved automatically in your browser.
Interpreting weekly latency trends for audit cycles
Accessibility audits are not one-and-done. WCAG conformance must be maintained over time, and regional latency is a moving target. A model update from OpenAI can shift inference times. A routing change at Azure can improve EU latency while degrading AP performance. Seasonal traffic spikes can push tail latencies well beyond normal ranges.
This is where weekly latency summaries become invaluable. By reviewing a weekly digest of per-region TTFT trends, you can:
- Spot gradual degradation before it crosses your SLO threshold.
- Correlate provider changes with latency shifts, if OpenAI ships a new model version on Tuesday and your São Paulo TTFT jumps 40% by Thursday, you have a clear signal.
- Prioritize audit re-checks for regions showing the most variance rather than re-auditing everything equally.
Common pitfalls when ignoring regional patterns
Teams that skip regional latency analysis in their accessibility audits tend to hit the same problems:
- "Works on my machine" bias. If your development team is in San Francisco and your CI/CD pipeline runs in US-East, you will never see the 3-second TTFT that your users in Lagos experience daily.
- Aggregate metrics hide outliers. A global P50 of 1.3 seconds looks great, until you realize that P95 in your fastest region is pulling down the P50 for regions where P95 is 4+ seconds.
- Accessibility regressions go undetected. A provider-side change that adds 500 ms globally might keep US users within SLO but push Tier 3 regions past the accessibility threshold. Without per-region alerting, you will not know until a user complains, or an auditor flags it.
- Incomplete audit reports. Auditors increasingly expect evidence that timing-dependent features have been tested under realistic network conditions. A report that only covers localhost or a single region will not satisfy a rigorous VPAT or conformance claim.
Frequently Asked Questions
stream: true) deliver the first token as soon as inference begins producing output, which dramatically reduces perceived TTFT. Non-streaming (blocking) responses force the user to wait for the entire completion, which can mean 5–20+ seconds of silence for a screen-reader user. Always prefer streaming for user-facing chat features.| Region | TTFT P50 | TTFT P95 | Accessibility risk |
|---|---|---|---|
| US-East (Virginia) | 0.9 s | 1.3 s | Low |
| EU-West (Frankfurt) | 1.2 s | 1.8 s | Low |
| AP-Northeast (Tokyo) | 1.6 s | 2.4 s | Medium |
| South America (São Paulo) | 2.0 s | 3.0 s | Medium |
| Africa (Johannesburg) | 2.5 s | 3.5 s | High |
Monitor your regional latency with Observinio
If your AI-powered features serve a global audience, regional latency is not optional telemetry, it is an accessibility requirement. Observinio monitors OpenAI and OpenRouter endpoints from 21 regions daily, compares each probe against learned baselines, and sends you email alerts the moment a region degrades beyond its normal range. Visit the status page to see current regional latency data, or get in touch to set up degradation alerts tailored to your accessibility SLOs.
Additional Resources
- Stateful Responses API Much Slower Than Chat ... - Responses API (AzureOpenAI) is significantly slower on average than the Chat Completions endpoint. Occasionally some Responses requests have ...
- AI Data Residency: Architecture Patterns + Compliance 2026 - All three major hyperscaler AI surfaces — AWS Bedrock, Google Vertex AI, and Azure OpenAI — support regional endpoints in 2026. Azure OpenAI ...
- Optimizing latency for Azure OpenAI Service - Clemens Siebler - In this post we'll be looking into measuring and optimizing Azure OpenAI Service response latency by evaluating the deployed endpoints Azure ...