
Photo by Lara Jameson from Pexels
When your monorepo deploys the same OpenAI-backed chat service to multiple cloud regions, you might expect latency to be roughly uniform. In practice, the spread between your fastest and slowest region can easily exceed 500 ms at the p95 level, enough to push a real-time chat feature from "snappy" to "sluggish." Understanding where that variance comes from, and how to track it continuously, is the difference between reacting to user complaints and preventing them.
TL;DR
- OpenAI chat completion latency varies significantly by region, even when your own infrastructure is identical across deployments.
- Monorepo setups amplify the problem because a single CI/CD pipeline often masks region-specific performance regressions.
- TTFB (Time to First Byte) and TTFT (Time to First Token) are the two metrics that matter most for streaming chat UX.
- Continuous synthetic probes from multiple regions, not just aggregate dashboards, are required to catch degradation early.
- Observinio monitors OpenAI and OpenRouter endpoints from 21 global regions daily, giving you the regional granularity your APM tool likely lacks.
Why monorepos make regional latency harder to spot

A monorepo typically means one source of truth for your chat service: a single packages/chat-api directory, one Dockerfile, one set of environment variables, and one deployment pipeline that fans out to us-east-1, eu-west-1, ap-southeast-1, and wherever else you run. This uniformity is a strength for code consistency, but it creates a blind spot for latency.
The aggregation trap
Most observability stacks default to showing you a single, global p50 or p95 for your /v1/chat/completions proxy endpoint. When that number looks fine, nobody investigates. But a healthy global p95 of 1.8 s can hide the fact that ap-southeast-1 is sitting at 3.2 s while us-east-1 enjoys 1.1 s. Your users in Singapore feel the pain; your dashboard does not.
Shared configuration, divergent paths
In a monorepo, the OpenAI API key, model selection, and timeout settings are typically shared across regions. What is not shared is the network path from each region's egress to OpenAI's inference fleet. OpenAI's endpoints resolve to infrastructure concentrated in specific US data centers. A request originating from Frankfurt takes a fundamentally different route, and encounters different backbone congestion, than one from Virginia.
Deployment cadence masks regressions
Monorepo CI/CD pipelines often deploy all regions in a single rollout. If a new prompt template or system message increases token count by 15 %, the latency impact shows up everywhere simultaneously. Without per-region baselines, you cannot tell whether the regression is your change or a provider-side slowdown isolated to one geography.
The metrics that matter: TTFB vs. TTFT vs. total completion time

Before you can reason about regional patterns, you need to agree on what you are measuring. Three latency metrics dominate OpenAI chat endpoint monitoring:
- TTFB (Time to First Byte): The interval from sending the HTTP request to receiving the first byte of the response. This captures DNS resolution, TCP/TLS handshake, and the provider's initial processing overhead. For non-streaming requests, TTFB is essentially the full round-trip.
- TTFT (Time to First Token): Relevant only for streaming (
stream: true) requests. TTFT measures the time until the first meaningful token arrives in the SSE stream. It is typically slightly longer than TTFB because the first SSE chunk may contain metadata before actual content tokens appear. - Total completion time: The wall-clock duration from request sent to final token received. This depends heavily on output token count and the model's generation speed, making it noisier for regional comparisons.
"Responses: mean=4.268s median=2.349s min=1.421s max=21.711s stdev=4.903sChat : mean=1.354s median=1.298s min=0.902s max=2.385s stdev=0.330s Statistical: Store = False." >, Stateful Responses API Much Slower Than Chat Completions
The community data above illustrates how even the choice of API surface (Responses API vs. Chat Completions) introduces dramatic variance. Layer regional network differences on top, and you can see why a single global average is dangerously misleading.
Common regional latency patterns

Based on continuous monitoring across multiple regions, several recurring patterns emerge for OpenAI chat endpoints:
- US East is the baseline. Regions like
us-east-1andus-east-2consistently show the lowest TTFB because they are geographically closest to OpenAI's primary inference infrastructure. If you are only testing from Virginia, you are seeing the best-case scenario. - Europe adds 80–200 ms. Western European regions (
eu-west-1,eu-central-1) typically add a consistent overhead that correlates with transatlantic round-trip time. This overhead is remarkably stable day-to-day, making it predictable but not eliminable. - Asia-Pacific shows the widest variance. Regions like
ap-southeast-1(Singapore),ap-northeast-1(Tokyo), andap-south-1(Mumbai) exhibit not just higher median latency but also significantly higher standard deviation. Backbone routing changes, submarine cable congestion, and time-of-day effects all contribute. - South America and Africa are outliers. If you serve users in São Paulo or Johannesburg, expect TTFT values that can be 2–3× the US East baseline. These regions also show more frequent latency spikes during peak US business hours when OpenAI's infrastructure is under heaviest load.
- Weekend vs. weekday matters. Provider-side load patterns create measurable differences. Saturday morning UTC often shows 10–20 % lower TTFB across all regions compared to Tuesday afternoon UTC.
| Region | Typical TTFB (gpt-4o, p50) | Variance |
|---|---|---|
| US East (us-east-1) | 600–800 ms | Low |
| EU West (eu-west-1) | 900–1 200 ms | Low–Medium |
| AP Southeast (ap-southeast-1) | 1 200–2 000 ms | High |
| SA East (sa-east-1) | 1 600–2 400 ms | High |
| AF South (af-south-1) | 1 800–2 600 ms | Very High |
Step-by-step: setting up per-region latency tracking in a monorepo
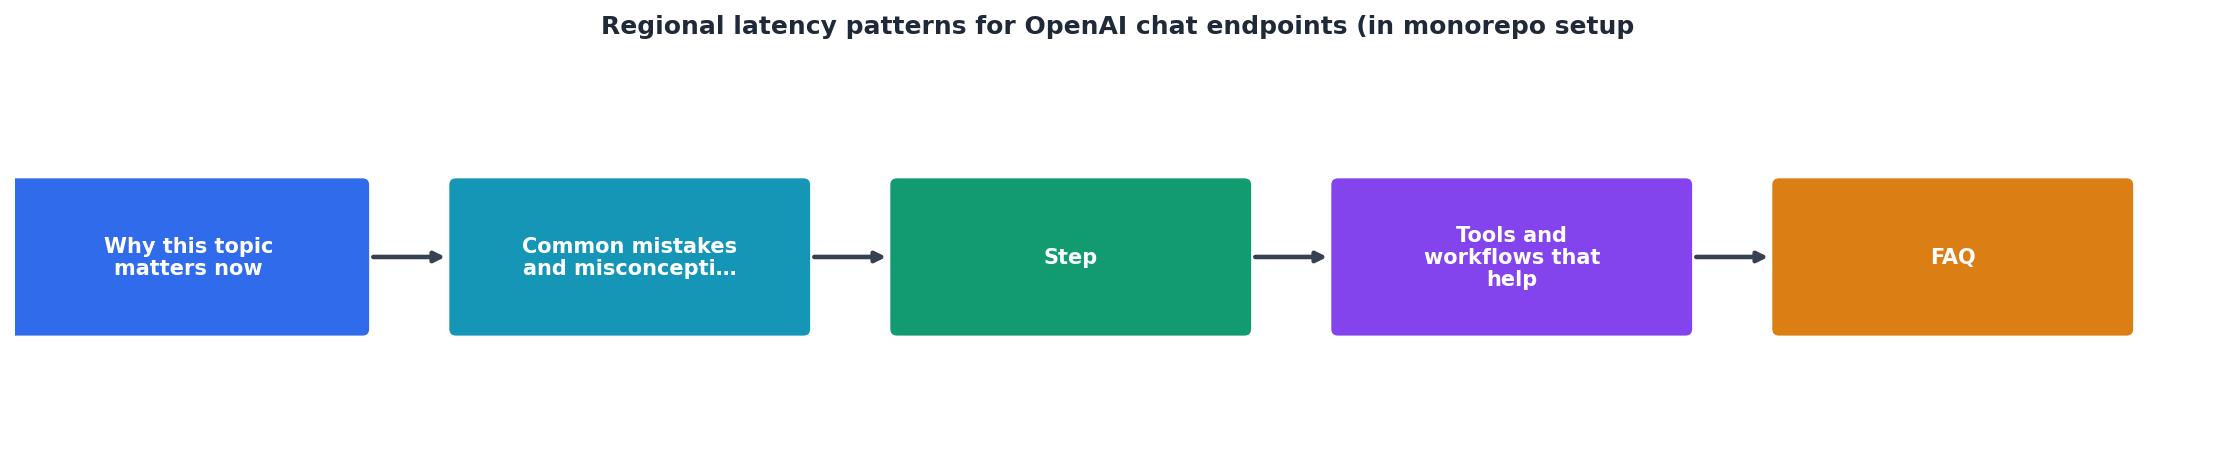
Follow these steps to move from a single global latency number to actionable per-region visibility:
- Instrument your OpenAI client wrapper with region tags. In your monorepo's shared HTTP client (e.g.,
packages/openai-client/src/index.ts), add aregionlabel to every latency metric you emit. Pull the value from an environment variable likeDEPLOY_REGIONthat your CI/CD sets per target.
- Separate TTFB from total duration. If you use streaming, record the timestamp when the first SSE
data:line arrives, not just when the stream closes. Most OpenAI SDK wrappers do not expose this by default, you will need a small middleware:
   const start = performance.now();
   const stream = await openai.chat.completions.create({
     model: "gpt-4o",
     messages,
     stream: true,
   });

let ttfbRecorded = false;
   for await (const chunk of stream) {
     if (!ttfbRecorded) {
       metrics.recordTTFB(performance.now() - start, { region: process.env.DEPLOY_REGION });
       ttfbRecorded = true;
     }
     // process chunk
   }
   metrics.recordTotal(performance.now() - start, { region: process.env.DEPLOY_REGION });
- Establish per-region baselines. Collect at least seven days of data before setting alert thresholds. A threshold that works for
us-east-1(e.g., p95 TTFB < 1.2 s) will fire constantly inap-southeast-1where the normal p95 might be 2.0 s.
- Create region-specific dashboards. Whether you use Grafana, Datadog, or a custom solution, build a dashboard with one panel per region showing TTFB p50, p90, and p95 over time. Place them side by side so deviations are visually obvious.
- Add external synthetic probes. Your own instrumentation only fires when real users make requests. During low-traffic hours in a given region, you have no data. Synthetic probes fill this gap by sending standardized requests on a schedule from each region, giving you continuous coverage regardless of traffic patterns.
- Set up degradation alerts with regional context. An alert that says "OpenAI latency is high" is not actionable. An alert that says "TTFB p95 in ap-southeast-1 exceeded baseline by 40 % for the last 30 minutes" tells your on-call engineer exactly where to look and whether it affects one region or all of them.
Checklist: regional latency hygiene for monorepo teams
Use this checklist during your next sprint planning to close observability gaps:
Your progress is saved automatically in your browser.
Frequently Asked Questions
eu-west-1 that caches or queues requests) does not reduce the fundamental network latency to OpenAI's US-based infrastructure. It can help with connection reuse and TLS session resumption, shaving 50–100 ms off cold-start requests, but it will not close a 300 ms transatlantic gap. The proxy is more useful for retry logic, rate-limit handling, and request logging than for raw latency reduction.gpt-4o with a moderate prompt (under 2,000 input tokens), a TTFB under 800 ms from US East is a reasonable baseline. From Western Europe, expect 900–1,200 ms. From Asia-Pacific, 1,200–2,000 ms. These numbers shift with model load, so treat them as starting points and adjust based on your own measured baselines rather than hard-coding them as SLO targets.Track regional latency before your users report it
If your monorepo deploys to multiple regions but your latency monitoring is still a single global number, you are flying partially blind. Observinio runs daily synthetic probes against OpenAI and OpenRouter endpoints from 21 regions worldwide, compares results against established baselines, and sends you email alerts when degradation hits, broken down by region, model, and endpoint. Check the status page to see current regional data, or visit the homepage to set up alerts for the regions your users actually care about.
Additional Resources
- Stateful Responses API Much Slower Than Chat ... - Responses API (AzureOpenAI) is significantly slower on average than the Chat Completions endpoint. Occasionally some Responses requests have ...
- We shaved 1000ms off OpenAI's latency. | Jordan D. - OpenAI's latency is pretty inconsistent. So we tracked 40+ Azure OpenAI deployments - some are fast on Friday, unusable on Monday. Each region ...
- Azure OpenAI in Microsoft Foundry Models performance & ... - This article provides you with background around how latency and throughput works with Azure OpenAI and how to optimize your environment to ...