
Photo by Aksonsat Uanthoeng from Pexels
You are about to route production traffic to OpenAI's chat completion endpoints. Before you flip the switch, you need to know how those endpoints actually behave from the regions your users live in, not just from your CI runner in us-east-1. Regional latency variance is one of the most under-measured risks in LLM-powered products, and it can easily add hundreds of milliseconds to time-to-first-token (TTFT) for users on the wrong side of the planet. This article walks through the patterns we consistently observe across 21 probe regions, explains why they matter for your cutover plan, and gives you a concrete pre-production checklist you can execute this week.
TL;DR
- OpenAI chat endpoints show measurable TTFT differences across regions, often 150–400 ms between the fastest and slowest probe locations.
- US-East and Western Europe typically report the lowest latency; Asia-Pacific and South America see the highest variance.
- Pre-production latency baselines prevent you from confusing provider-side slowdowns with bugs in your own stack after launch.
- A structured probe schedule (daily, multi-region) catches regressions that aggregate dashboards hide.
- Observinio's 21-region daily probes and degradation alerts give you this data without building custom infrastructure.
Why regional latency matters before you go live
Most teams benchmark OpenAI endpoints from a single cloud region, usually wherever their backend runs. That single number becomes the mental model for "how fast the API is." The problem is that this number can be wildly unrepresentative for a global user base.
Consider a chat application serving users in Tokyo, São Paulo, and Frankfurt. A TTFT measurement of 320 ms from us-east-1 tells you nothing about what a user in ap-northeast-1 will experience. Network hops, TLS negotiation overhead, and OpenAI's own internal routing all contribute to region-dependent latency profiles. If you set your loading-spinner timeout or streaming-chunk expectations based on a single-region test, you will either frustrate distant users or trigger false-positive error handling.
Before production cutover is the ideal moment to capture these baselines because:
- You have no live traffic to confuse the signal.
- You can run controlled, identical prompts from every region.
- The resulting data becomes your "day-zero" reference for every future degradation alert.
The patterns we see across 21 regions

Observinio runs daily synthetic probes against OpenAI chat completion endpoints (and OpenRouter equivalents) from 21 global regions. While exact numbers shift day to day, the structural patterns are remarkably stable. Here is what we consistently observe:
Tier 1, Lowest latency (typically under 500 ms TTFT)
- US-East (Virginia, Ohio): Closest to OpenAI's primary inference infrastructure. TTFT is consistently the lowest, and variance between daily probes is tight.
- US-West (Oregon, California): Slightly higher than US-East but still within a narrow band. Cross-continent backbone links within the US keep overhead minimal.
- Western Europe (Frankfurt, London, Ireland): Benefits from well-peered transatlantic routes. Frankfurt often edges out London by a small margin.
Tier 2, Moderate latency (500–800 ms TTFT range)
- Central Europe (Warsaw, Stockholm): An additional network hop compared to Frankfurt, but generally stable.
- Canada (Montreal, Toronto): Close to US-East geographically, yet occasionally shows spikes that US-East does not, likely due to different peering paths.
- Australia (Sydney): Surprisingly competitive given the distance, possibly due to dedicated submarine cable capacity to US-West.
Tier 3, Higher latency and wider variance (800 ms+ TTFT)
- Asia-Pacific (Tokyo, Singapore, Mumbai, Seoul): TTFT regularly exceeds 800 ms. Tokyo and Seoul tend to cluster together; Mumbai and Singapore show wider day-to-day variance.
- South America (São Paulo, Buenos Aires): Consistently the highest TTFT in our probe set. Variance is also the widest, suggesting less predictable routing.
- Middle East / Africa (Bahrain, Cape Town): Limited peering options to OpenAI's US-based infrastructure result in elevated and variable latency.
| Tier | Regions | Typical TTFT | Variance |
|---|---|---|---|
| Tier 1 – Lowest | US-East, US-West, Western Europe | < 500 ms | Low |
| Tier 2 – Moderate | Central Europe, Canada, Australia | 500–800 ms | Moderate |
| Tier 3 – Higher | Asia-Pacific, South America, Middle East/Africa | 800 ms+ | High |
What drives these tiers
The dominant factor is physical distance to OpenAI's inference clusters, which are concentrated in the United States. But distance alone does not explain everything. TLS handshake overhead scales with round-trip time (each additional RTT during the handshake adds latency proportional to the geographic distance). OpenAI's load-balancer routing decisions can also shift traffic between internal clusters, introducing variance that is invisible to the caller. Finally, time-of-day effects are real: US business hours correlate with higher queue times on OpenAI's side, which disproportionately affects regions whose peak usage overlaps with US peaks.
Measuring the right metrics
Not all latency numbers are equally useful for a pre-production assessment. Here is what to capture and why:
- TTFB (Time to First Byte): The interval from sending the HTTP request to receiving the first byte of the response. This captures network latency plus server-side queuing but not token generation time.
- TTFT (Time to First Token): For streaming endpoints, this is the time until the first content token arrives. It is the metric your users actually feel, the delay before text starts appearing.
- P50 / P95 / P99: Median latency hides tail behavior. A P50 of 400 ms with a P99 of 2,200 ms means one in a hundred requests will feel broken. Always capture percentiles.
- Variance (standard deviation or IQR): A region with a low median but high variance is harder to design around than a region with a slightly higher but stable median.
Pre-production latency baseline checklist
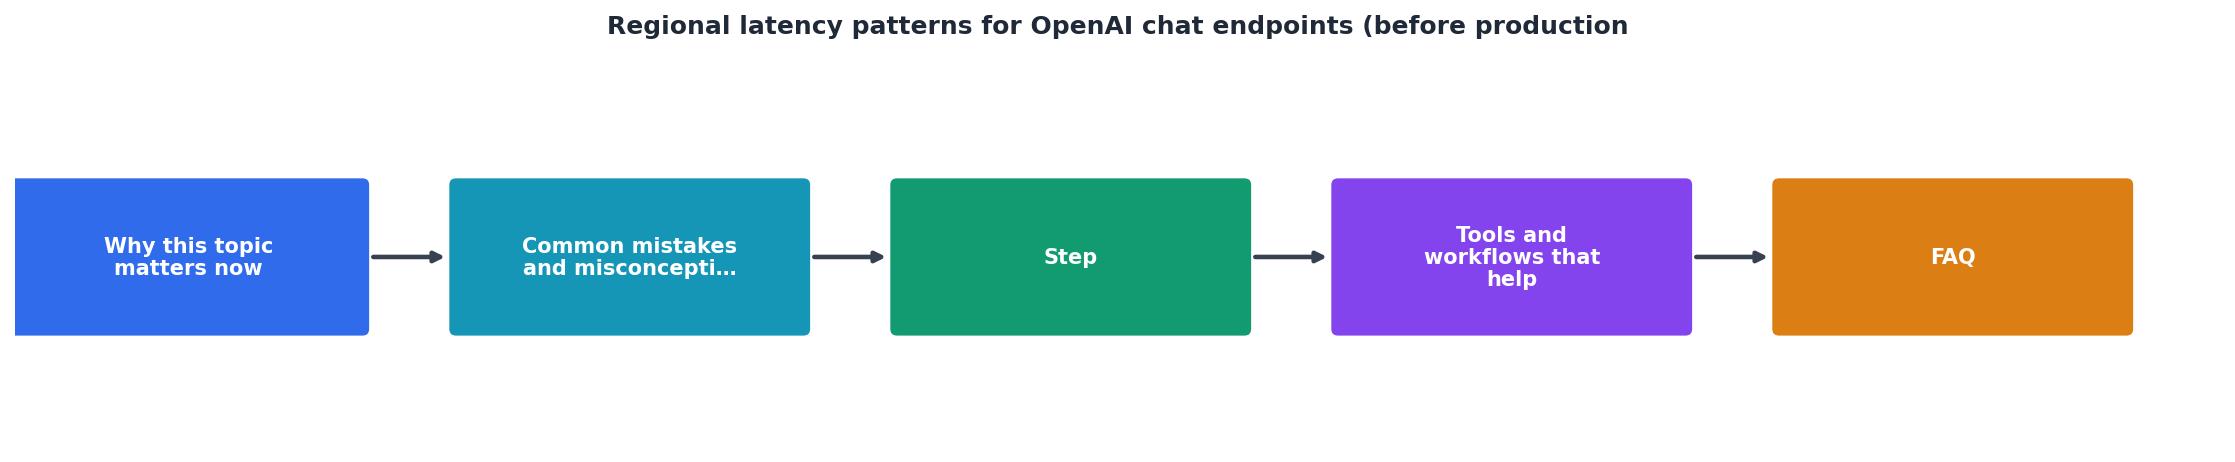
Use this checklist before you route real user traffic to OpenAI chat endpoints. Each step is designed to be completed in order, and the whole process can run over three to five days.
Your progress is saved automatically in your browser.
Turning baselines into routing decisions

Once you have regional baselines, you can make informed architectural decisions rather than guessing:
- Region-aware routing: If your backend runs in multiple regions, route OpenAI API calls from the region closest to OpenAI's infrastructure (typically US-East) rather than from the region closest to the user. The user-to-your-backend leg is usually faster than the your-backend-to-OpenAI leg, so optimizing the latter yields a bigger improvement.
- Provider fallback logic: If a region's TTFT degrades past its baseline P95, automatically fall back to an alternative provider or model. Your baseline data tells you exactly where to set that threshold.
- Model selection by region: Smaller models (e.g.,
gpt-4o-minivs.gpt-4o) have lower TTFT across all regions. For latency-sensitive regions in Tier 3, consider defaulting to a faster model and offering the larger model as an opt-in. - OpenRouter vs. direct comparison: Run the same probe set against both OpenAI direct and OpenRouter endpoints. In some regions, OpenRouter's routing layer adds measurable overhead; in others, its caching and load-balancing can actually reduce variance. Your baseline data will show which is true for your specific regions.
Example: region-aware probe with curl
Below is a minimal probe script you can run from any cloud function to capture TTFB and TTFT for a streaming chat completion request:
#!/bin/bash

ENDPOINT="https://api.openai.com/v1/chat/completions"
MODEL="gpt-4o-mini"
API_KEY="${OPENAI_API_KEY}"

START=$(date +%s%N)

curl -s -o /tmp/probe_response.txt -w "ttfb:%{time_starttransfer}" \
  -X POST "$ENDPOINT" \
  -H "Authorization: Bearer $API_KEY" \
  -H "Content-Type: application/json" \
  -d '{
    "model": "'"$MODEL"'",
    "stream": true,
    "messages": [
      {"role": "system", "content": "You are a helpful assistant."},
      {"role": "user", "content": "Summarize the benefits of regional latency monitoring in two sentences."}
    ]
  }'

END=$(date +%s%N)
TOTAL_MS=$(( (END - START) / 1000000 ))
echo "Total response time: ${TOTAL_MS}ms"
Run this from cloud functions in each of your target regions, log the output, and you have the raw data for your baseline spreadsheet.
Common pitfalls to avoid
- Testing only during off-peak hours. OpenAI's endpoints are busiest during US business hours (roughly 14:00–22:00 UTC). If you only probe at 04:00 UTC, your baselines will be optimistically low.
- Using variable-length prompts. Token generation time scales with output length. If your probe prompt sometimes triggers a 50-token response and sometimes a 500-token response, your TTFT measurements will be noisy for the wrong reasons.
- Ignoring cold-start effects. The first request after a long idle period may be slower due to connection setup. Run a warm-up request before recording probe data.
- Averaging across regions. A global average TTFT of 600 ms is meaningless if São Paulo is at 1,200 ms and Virginia is at 250 ms. Always report per-region.
- Skipping the post-cutover comparison. Production traffic patterns (concurrent requests, varied prompt lengths, authentication overhead) change the latency profile. Your pre-production baseline is a starting point, not a permanent truth.
Frequently Asked Questions
us-east-1 will underestimate TTFT for users in Asia-Pacific by 300–600 ms or more. Always baseline from the regions where your users actually are, or use a multi-region monitoring service like Observinio that covers 21 locations automatically.Start monitoring before you cut over
If you are planning a production cutover to OpenAI chat endpoints, regional latency baselines are not optional, they are the foundation of every SLO, alert threshold, and routing decision you will make afterward. Observinio gives you daily probes from 21 regions, automatic baseline comparison, and email alerts when any region degrades beyond its normal range. Set up your Observinio alerts before cutover day so you have clean baselines waiting when production traffic starts flowing.