
Photo by Ahmet Yüksek ✪ from Pexels
Design operations teams increasingly rely on OpenAI chat endpoints to power everything from automated copy generation to real-time design-token suggestions. When those endpoints respond in 900 ms from US-East but take 3.5 seconds from Singapore, the design review pipeline stalls and stakeholders lose trust in the tooling. Understanding where and why latency varies across regions is the first step toward keeping design ops workflows predictable, no matter where your team sits.
TL;DR
- OpenAI chat completion latency can differ by 2–4× between the closest and farthest regions from Azure's US hosting infrastructure.
- Time to First Byte (TTFB) and Time to First Token (TTFT) are the two metrics that matter most for interactive design-ops tooling.
- Routing through OpenRouter adds a measurable hop but can unlock fallback models when the primary endpoint degrades.
- Daily synthetic probes from multiple regions are the only reliable way to separate provider-side slowdowns from your own network path.
- Setting per-region latency baselines lets you trigger alerts before designers notice the lag.
Why regional latency matters for design ops

Design ops is not a batch job. When a designer in a Figma plugin clicks "Generate alt text" or "Suggest layout variant," the perceived quality of the tool is directly proportional to how fast the response appears. A chat completion call that consistently finishes under 1.5 seconds feels instant; one that occasionally spikes to 6 seconds feels broken.
OpenAI serves chat completions primarily through Azure data centers concentrated in the US East and US South Central regions. If your design team is distributed across London, Tokyo, and São Paulo, each location experiences a different network path, different TLS handshake time, and different queuing behavior at the provider edge. These differences compound when the model is under heavy load during peak US business hours, exactly when your European afternoon design reviews are happening.
For platform engineers supporting design-ops tooling, the challenge is twofold: you need to know the baseline latency each region should expect, and you need to detect when reality deviates from that baseline. Without regional granularity, a global average of 1.8 seconds hides the fact that Asia-Pacific users are experiencing 4-second waits while US users enjoy sub-second responses.
Key latency metrics to track

Not all latency numbers tell the same story. Here are the metrics that matter most when you are optimizing OpenAI chat endpoints for design-ops use cases:
TTFB, Time to First Byte
This measures the duration from the moment your HTTP request leaves the client until the first byte of the response arrives. It captures DNS resolution, TCP/TLS setup, and server-side queuing. For non-streaming calls, TTFB is essentially the full round-trip time. For streaming calls, it tells you how long the designer stares at a blank output area before anything appears.
TTFT, Time to First Token
When you use stream: true in the chat completions API, TTFT measures how long it takes for the model to begin generating output. This is the metric that most directly correlates with perceived speed in interactive design tools. A TTFT under 800 ms generally feels responsive; above 2 seconds, users start switching tabs.
P95 and P99 tail latency
Averages lie. A mean of 1.3 seconds can mask a P99 of 8 seconds. Design-ops workflows often involve bursts of parallel requests, generating five headline variants at once, for example, so tail latency determines how long the slowest request in the batch takes. Track P95 and P99 per region to understand worst-case user experience.
Key takeaway: For interactive design-ops tools, always track TTFT per region rather than relying on a global average — a single global number hides the 2–4× latency gap between your fastest and slowest regions.
Standard deviation
High standard deviation signals unpredictable performance, which is arguably worse than consistently slow performance. If your São Paulo probe shows a mean of 2.1 seconds with a standard deviation of 3.8 seconds, the endpoint is essentially unusable for real-time design tooling from that region.
"Responses: mean=4.268s median=2.349s min=1.421s max=21.711s stdev=4.903sChat : mean=1.354s median=1.298s min=0.902s max=2.385s stdev=0.330s Statistical: Store = False." >, Stateful Responses API Much Slower Than Chat Completions
The community data above illustrates the gap clearly: the Chat Completions endpoint delivers a tight distribution (stdev 0.330 s) while the newer Responses API shows wild variance (stdev 4.903 s). For design ops, this means sticking with the Chat Completions endpoint is the safer choice until the Responses API stabilizes, and monitoring both from your key regions is the only way to know when that changes.
Observed regional patterns

Based on synthetic probe data collected across 21 global regions, several consistent patterns emerge for OpenAI chat completion endpoints:
- US East and US Central consistently show the lowest TTFT, typically under 1 second for
gpt-4o-miniand under 1.5 seconds forgpt-4o. This is expected given proximity to Azure's primary serving infrastructure. - Western Europe (Frankfurt, London, Amsterdam) adds roughly 100–250 ms of network overhead on top of the US baseline. During off-peak hours, European latency can approach US levels; during US business hours, queuing delays push it higher.
- Asia-Pacific (Tokyo, Singapore, Sydney) shows the widest variance. TTFT for
gpt-4ocan range from 1.8 seconds to over 5 seconds depending on time of day and model load. Sydney in particular suffers from limited peering paths to US Azure regions. - South America (São Paulo) and Africa (Johannesburg) experience the highest baseline latency, often 2–3× the US East numbers. These regions also show the highest standard deviation, making them the least predictable.
- Middle East (Bahrain, Dubai) falls between Europe and Asia-Pacific, with TTFT typically 1.5–2.5 seconds for
gpt-4o. Routing through European Azure regions sometimes improves performance compared to direct US paths.
| Region | Median TTFT | P95 TTFT | Std Dev |
|---|---|---|---|
| US East | 0.6 s | 1.1 s | 0.25 s |
| Western Europe | 0.9 s | 1.8 s | 0.45 s |
| Asia-Pacific | 1.8 s | 4.2 s | 1.30 s |
| South America | 2.1 s | 5.0 s | 1.60 s |
| Middle East | 1.5 s | 3.0 s | 0.80 s |
Step-by-step: setting up regional latency baselines for your design-ops stack
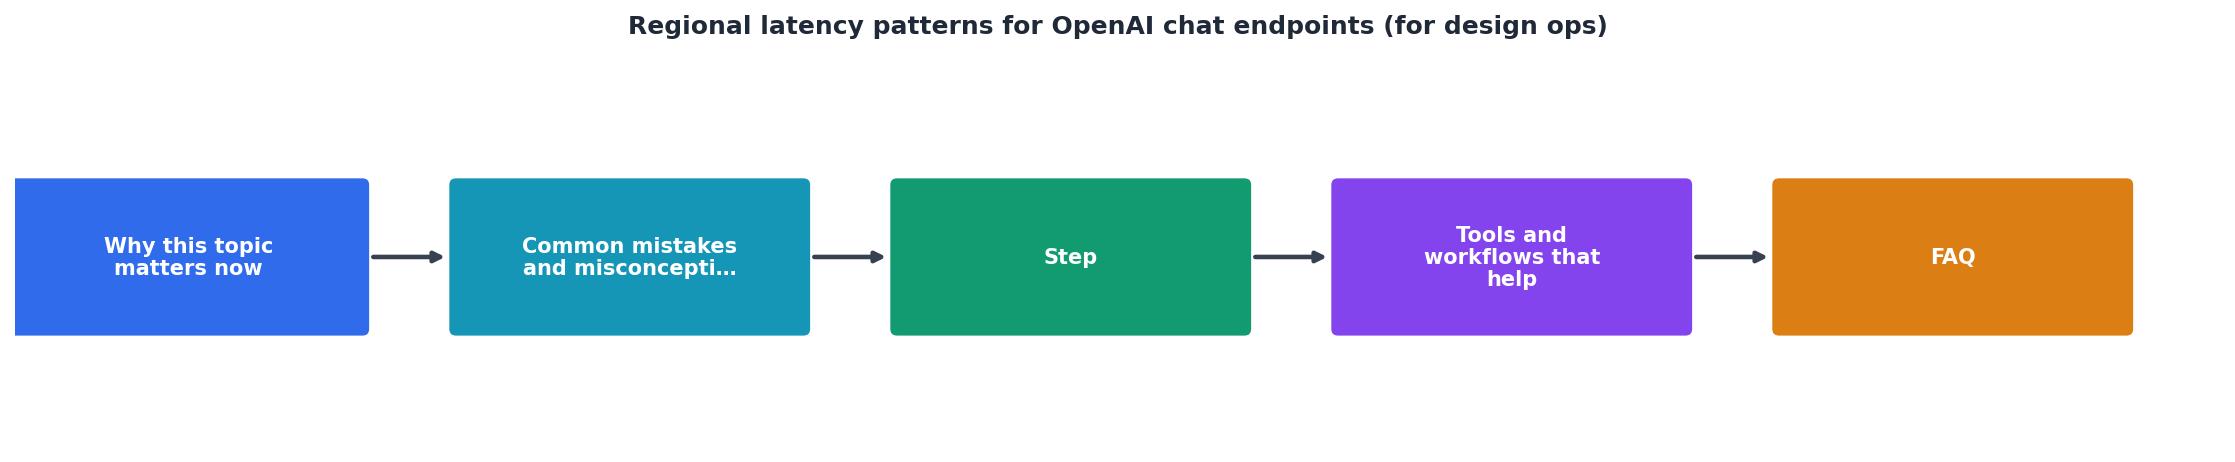
Follow these steps to establish actionable baselines and catch regressions before they disrupt your design team:
- Identify your team's regions. List every city or cloud region where designers, reviewers, or automated pipelines call the OpenAI chat endpoint. If your Figma plugin backend runs in
eu-west-1but designers are in Tokyo, both regions matter. - Choose your probe model and prompt. Pick the exact model your design-ops tool uses (e.g.,
gpt-4o-mini) and a representative prompt. A 50-token system prompt plus a 20-token user message is a good starting point, it mirrors a typical "generate alt text" call. - Run daily probes from each region. Use a synthetic monitoring service that sends the same request from each region at consistent intervals. Observinio runs probes from 21 regions daily, which gives you a rolling dataset without any infrastructure to maintain.
- Record TTFB, TTFT, and total response time. Store each metric separately. TTFB tells you about network and queuing; TTFT tells you about model inference start; total time tells you about generation length.
- Calculate per-region baselines after 7 days. Compute the median, P95, and standard deviation for each region. The median is your baseline; the P95 is your alert threshold candidate.
- Set degradation alerts. Configure alerts that fire when a region's rolling median exceeds its baseline by more than 40%, or when P95 crosses a hard ceiling (e.g., 4 seconds for
gpt-4o-mini). Observinio's email alerts can notify you when these thresholds are breached. - Review weekly summaries. Every Monday, check the weekly latency trend report. Look for regions where standard deviation is creeping up, that often precedes a sustained degradation event.
- Adjust routing or model selection. If a region consistently exceeds your latency SLO, consider routing those requests through a closer proxy, switching to a faster model for that region, or using OpenRouter's fallback capabilities to try an alternative provider.
Practical checklist: regional latency hygiene for design-ops teams
Use this checklist during your quarterly design-ops tooling review:
Your progress is saved automatically in your browser.
Direct OpenAI vs. OpenRouter: what the regional data shows
For design-ops teams evaluating whether to call OpenAI directly or route through OpenRouter, regional latency data reveals a nuanced picture. Direct OpenAI calls eliminate one network hop, which typically saves 50–150 ms in US regions. However, OpenRouter provides model fallback and load distribution that can reduce tail latency during provider-side incidents.
From European regions, the difference between direct and routed calls narrows because the additional hop to OpenRouter's edge is partially offset by OpenRouter's optimized peering. From Asia-Pacific, the extra hop is more noticeable, expect an additional 100–300 ms on median TTFT when routing through OpenRouter compared to direct calls.
The decision depends on your reliability requirements. If your design-ops tool can tolerate occasional 5-second spikes in exchange for never hitting a hard failure, OpenRouter's fallback routing is valuable. If sub-second TTFT is non-negotiable for your US-based team, direct OpenAI calls with your own retry logic may be the better path. Either way, monitor both paths from your key regions so the decision is data-driven rather than anecdotal. You can compare provider performance side by side on the Observinio status page.
Frequently Asked Questions
gpt-4o in one month may be off by 30% or more after a version bump. A 7-day rolling window gives you enough data points to smooth out daily variance while staying responsive to real shifts.stream: true, the designer sees the first tokens appear as soon as the model begins generating, rather than waiting for the entire response. This reduces perceived wait time from the total response duration to the TTFT, which is typically 40–60% shorter. For design-ops use cases like generating copy variants or alt text, streaming lets the user start reading and evaluating output almost immediately, even if the full generation takes several seconds.gpt-4o-mini; for gpt-4o, add roughly 40–60% to each threshold.Start tracking regional latency before your designers do
If your design-ops pipeline depends on OpenAI chat endpoints, regional latency monitoring is not optional, it is infrastructure. Observinio's daily probes from 21 regions give you per-region baselines, automatic degradation alerts, and weekly trend summaries without deploying a single agent. Set up alerts on the Observinio status page and get notified by email the moment a region drifts outside its baseline, so you can fix routing before the next design review turns into a latency complaint session.
Additional Resources
- Stateful Responses API Much Slower Than Chat ... - Responses API (AzureOpenAI) is significantly slower on average than the Chat Completions endpoint. Occasionally some Responses requests have ...
- Azure OpenAI Architecture: The Decisions That Actually ... - Cons: No guaranteed throughput or low-latency SLA – performance may vary with regional load. ... Your endpoint isn't tied to a specific region.
- AI Data Residency: Architecture Patterns + Compliance 2026 - This guide covers the six architecture patterns we use to keep AI workloads in-region across EU, UK, APAC, and GCC deployments — the vendor ...