
Photo by Ahmet Yüksek ✪ from Pexels
You picked a model, wired up the OpenAI chat completions endpoint, and everything felt snappy during local testing. Then a user in São Paulo reports two-second waits before the first token appears, while your demo in Virginia still feels instant. If you are a solo developer or a small-team CTO without a dedicated platform squad, regional latency patterns are easy to overlook, and painful to debug after launch. This guide breaks down what actually causes those differences, how to measure them without building a full observability stack, and what you can do about it today.
TL;DR
- OpenAI chat completion latency varies significantly by region, differences of 200–800 ms in Time to First Byte (TTFB) between US-East and regions like Southeast Asia or South America are common.
- The main drivers are network distance to OpenAI's inference clusters, TLS handshake overhead, and variable server-side queue times that shift throughout the day.
- You do not need Datadog or a custom probe fleet to track this; lightweight synthetic checks from multiple regions give you the data you need.
- Choosing the right endpoint variant matters: the newer Responses API can carry measurably higher latency than the classic Chat Completions endpoint for equivalent prompts.
- A weekly latency baseline lets you spot regressions before your users do.
Why regional latency matters when you are shipping alone

When a large platform team notices a latency spike, they have runbooks, on-call rotations, and APM dashboards ready. As a solo builder, you are usually the one who discovers the problem, often because a customer tweets about it or your Stripe churn dashboard ticks up. Regional latency patterns for OpenAI chat endpoints are not academic; they directly affect perceived product quality.
Consider a typical chat-based feature: the user sends a message, your backend forwards it to POST https://api.openai.com/v1/chat/completions, and the response streams back. The total wall-clock time your user experiences breaks down into three chunks:
- Network round-trip, your server to OpenAI's edge, through their load balancer, to an inference node, and back. This is heavily influenced by physical distance and peering quality.
- Server-side queue and inference, how long OpenAI takes to schedule your request and start generating tokens. This varies by model, load, and time of day.
- Streaming transfer, once tokens start flowing, each chunk travels back over the same network path.
The anatomy of regional variance

OpenAI's primary inference infrastructure is concentrated in the United States, with capacity largely hosted on Microsoft Azure data centers in US-East and US-South-Central regions. When your application server sits in us-east-1 (Virginia), the network hop to OpenAI is minimal, often under 10 ms for the TCP/TLS handshake alone. Move that server to eu-west-1 (Ireland) and the handshake alone can add 80–120 ms. Deploy in ap-southeast-1 (Singapore) and you may see 200–300 ms just for the connection setup, before a single token is generated.
Key latency components by region
| Region bucket | Typical TLS handshake | Observed TTFB range (GPT-4o-class) | Notes |
|---|---|---|---|
| US-East | 5–15 ms | 400–900 ms | Closest to inference clusters |
| US-West | 30–50 ms | 500–1 100 ms | Cross-continent hop adds ~40 ms |
| Europe (West) | 80–130 ms | 600–1 400 ms | Transatlantic cable latency |
| Asia-Pacific (East) | 150–250 ms | 800–2 000 ms | Longest consistent path |
| South America | 120–200 ms | 700–1 800 ms | Routing often goes through US-East |
Chat Completions vs. Responses API
Not all OpenAI endpoints behave the same. The newer Responses API, which maintains server-side conversation state, introduces additional overhead compared to the stateless Chat Completions endpoint. Community benchmarks confirm this clearly:
"Responses: mean=4.268s median=2.349s min=1.421s max=21.711s stdev=4.903sChat : mean=1.354s median=1.298s min=0.902s max=2.385s stdev=0.330s Statistical: Store = False." >, Stateful Responses API Much Slower Than Chat Completions
The difference is stark: a median of 2.35 seconds versus 1.30 seconds, with the Responses API also showing far higher variance (stdev of 4.9 s vs. 0.33 s). For a solo developer optimizing for consistent user experience, sticking with the Chat Completions endpoint, and managing conversation state yourself, can cut perceived latency nearly in half and dramatically reduce tail-latency surprises.
Median: 1.30 s
Stdev: 0.33 s
✅ Predictable, low variance
Median: 2.35 s
Stdev: 4.90 s
⚠️ High variance, tail-latency risk
How to measure regional latency without a platform team

You do not need to spin up probe servers in twenty regions yourself. Here is a practical approach that scales from "just me" to "me plus a contractor."
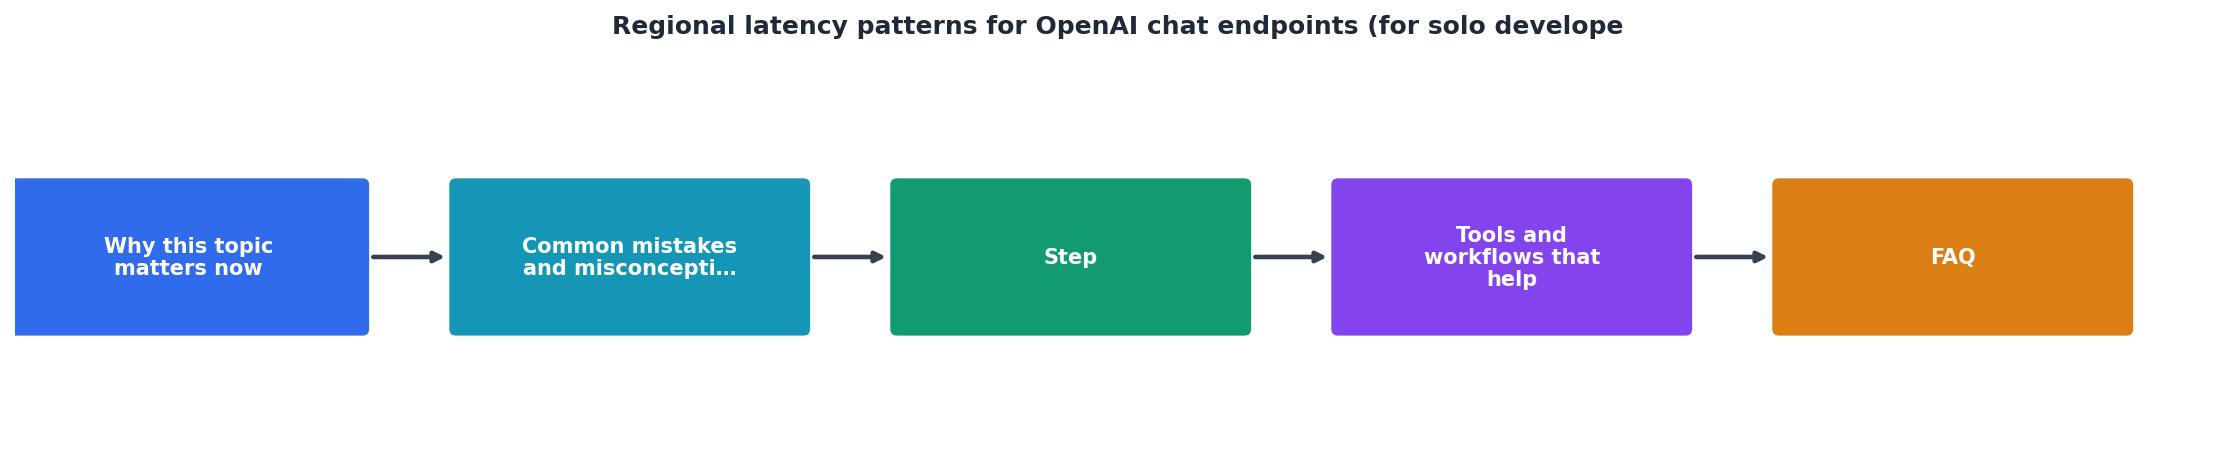
Step-by-step: setting up regional latency visibility
- Identify your user regions. Check your analytics (even simple Cloudflare or Vercel geo data) to find the top three to five countries where your users live. Map each to the nearest cloud region.
- Instrument your existing API calls. Add timestamps around your OpenAI call in your backend. Record three values per request:
t_start: just before the HTTP request fires.t_first_byte: when the first chunk of the streamed response arrives (this is your TTFB / TTFT).t_end: when the final chunk arrives.
   import time
   import openai

client = openai.OpenAI()

t_start = time.monotonic()
   stream = client.chat.completions.create(
       model="gpt-4o",
       messages=[{"role": "user", "content": "Say hello in one sentence."}],
       stream=True,
   )

t_first_byte = None
   for chunk in stream:
       if t_first_byte is None:
           t_first_byte = time.monotonic()
   t_end = time.monotonic()

print(f"TTFB: {t_first_byte - t_start:.3f}s")
   print(f"Total: {t_end - t_start:.3f}s")
- Log to a simple store. Even a CSV file or a SQLite database is enough at this stage. Record the timestamp, region (you can tag it from an environment variable on your server), TTFB, and total duration.
- Establish a baseline. Run this for one full week. Calculate the median and p95 TTFB for each region. This is your baseline, the number you compare future measurements against.
- Set up alerts for deviations. When your median TTFB exceeds 1.5× the baseline for more than 30 minutes, you want to know. You can build this with a cron job and an email, or you can let a service handle it for you.
What to watch for in your data
- Time-of-day patterns: Expect higher latency during US business hours. If your users are in Asia-Pacific, their morning (your night) may actually be the fastest window.
- Model-specific differences: Smaller models like
gpt-4o-miniconsistently show lower TTFB than fullgpt-4o. If your feature does not need the larger model's reasoning depth, switching can shave 200–400 ms off median response times. - Sudden jumps: A TTFB that doubles overnight usually means OpenAI changed something on their side, a model update, infrastructure migration, or capacity rebalancing. These are not announced in advance.
Practical checklist: reducing latency as a solo developer
Use this checklist to systematically lower the latency your users experience:
Your progress is saved automatically in your browser.
Key takeaway: Regional latency for OpenAI chat endpoints is dominated by network distance and endpoint choice, not model speed alone. Deploying in US-East and using the Chat Completions API instead of the Responses API can cut your median TTFB by 40–50%, and a simple weekly baseline lets you catch regressions before users notice them.
When to use a dedicated monitoring service
Building your own latency tracking works for a single region and a handful of requests per minute. But once you care about multiple regions, or once you need to distinguish "is this my code, my hosting provider, or OpenAI?", a dedicated service saves hours of debugging.
Observinio runs daily synthetic probes against OpenAI (and OpenRouter) endpoints from 21 global regions. Each probe measures TTFB and total response time for standardized prompts, then compares the result against a rolling baseline. When latency in a specific region degrades beyond the threshold, you get an email alert, no dashboards to watch, no cron jobs to maintain. The weekly summary email gives you a trend view so you can spot gradual regressions before they become user-facing problems. You can check the current state anytime on the Observinio status page or drill into provider-specific data.
Frequently Asked Questions
store=False on the Responses API, you reduce some of that overhead, but the Chat Completions endpoint still tends to be faster and more predictable for equivalent prompts.Additional Resources
- Stateful Responses API Much Slower Than Chat ... - GPT-5 (minimal reasoning) is averaging about 5-7 sec. Responses API (AzureOpenAI) is significantly slower on average than the Chat Completions ...
- Azure OpenAI in Microsoft Foundry Models performance & ... - This article provides you with background around how latency and throughput works with Azure OpenAI and how to optimize your environment to ...
- LLM Router Latency Benchmark 2026: OpenAI Direct vs ... - OpenRouter was actually 70ms faster than OpenAI direct on time to first token (0.640s vs 0.712s) and Opper matched OpenAI directly within ...