
Photo by Thomas Lin from Pexels
If your product serves users across multiple continents, you already know that a single "average latency" number for the OpenAI chat completions endpoint is almost meaningless. A request originating in Frankfurt can behave very differently from one leaving São Paulo or Tokyo, even when both hit the same model version. For enterprise platform teams, understanding where and why those differences appear is the first step toward predictable latency SLOs and happier end-users.
This article breaks down the regional latency patterns we observe across OpenAI chat endpoints, explains the infrastructure factors behind them, and gives you a concrete playbook for monitoring and mitigating regional variance in production.
TL;DR
- OpenAI chat endpoint latency varies significantly by region, TTFB differences of 200–600 ms between the fastest and slowest probe locations are common during peak hours.
- The main drivers are geographic distance to Azure inference clusters, regional network peering quality, and time-of-day load patterns.
- Enterprise teams should measure from every region where they have users, not just from their own cloud region.
- Baseline comparison (not raw numbers) is the most reliable way to detect degradation early.
- Automated daily probes from multiple regions, like those Observinio runs from 21 locations, turn guesswork into data.
Why aggregate latency numbers mislead enterprise teams

Most provider status pages report a single global metric, often a median or p50 response time. That number hides the distribution tails that matter most to platform engineers. Consider a scenario where your US-East users enjoy a 380 ms TTFB while your Singapore users consistently see 900 ms. The global median might sit at a comfortable 520 ms, and no alert fires. Meanwhile, your APAC customers are churning because the chat feature feels sluggish.
Enterprise teams typically operate under latency SLOs defined per region or per user cohort. A single aggregate number cannot satisfy that requirement. You need per-region baselines, per-region trend lines, and per-region alerting thresholds.
The three layers of regional variance
Regional latency differences for OpenAI chat endpoints stem from three compounding layers:
- Network distance and routing, OpenAI inference runs primarily on Azure data centers. A request from a region without a nearby Azure presence travels further, accumulating round-trip time. BGP routing decisions, submarine cable paths, and ISP peering agreements all add unpredictable milliseconds.
- Inference cluster load, Azure regions serving OpenAI traffic experience different load curves depending on time zone. US-East clusters see peak utilization during North American business hours, which can increase queue wait times and inflate TTFB for everyone routed there.
- Token-level throughput shaping, Streaming chat completions means the first token (TTFT) and subsequent token rate are both affected by server-side scheduling. Larger prompts with low cache-hit rates consume more compute per request, amplifying regional differences under load.
"The amount of throughput that you can achieve on the endpoint depends on the workload shape, including input token amount, output amount, call rate, and cache match rate.">, Azure OpenAI in Microsoft Foundry Models performance & latency
This quote underscores a critical point: latency is not just about geography. Your workload shape interacts with regional infrastructure capacity to produce the final number your users experience.
Patterns we see across 21 probe regions

Observinio runs daily synthetic probes against OpenAI (and OpenRouter) endpoints from 21 global regions. While we do not publish raw benchmark numbers without proper methodology context, we can describe the consistent patterns that emerge week after week.
Pattern 1: US-East consistently leads
Probes originating from US-East (Virginia area) almost always record the lowest TTFB for OpenAI direct endpoints. This aligns with the known concentration of Azure OpenAI inference capacity in the eastern United States. If your primary user base is in North America, you are likely seeing the best-case scenario already.
Pattern 2: Western Europe is close, but not identical
Frankfurt, London, and Amsterdam probes typically land within a narrow band, slightly higher than US-East but well within acceptable SLO ranges for most applications. The difference is usually attributable to one additional network hop and the Atlantic crossing. However, during US business-hour peaks, European probes sometimes outperform US-East probes because the European requests may be routed to less-loaded clusters.
Pattern 3: APAC and South America show the widest variance
Probes from Tokyo, Sydney, Mumbai, and São Paulo exhibit the highest TTFB values and, crucially, the highest variance. A São Paulo probe might return a TTFB of 600 ms on one day and 1100 ms the next, without any obvious incident on the provider side. This variance makes it especially hard to set static alerting thresholds for these regions.
Pattern 4: Time-of-day shifts are real and measurable
Latency from any given region is not constant throughout the day. We observe a clear diurnal pattern: latency rises during the business hours of whichever time zone dominates the inference cluster handling the request. For enterprise teams running 24/7 services, this means your worst-case latency window shifts depending on where your users are and when they are active.
A practical playbook for regional latency monitoring
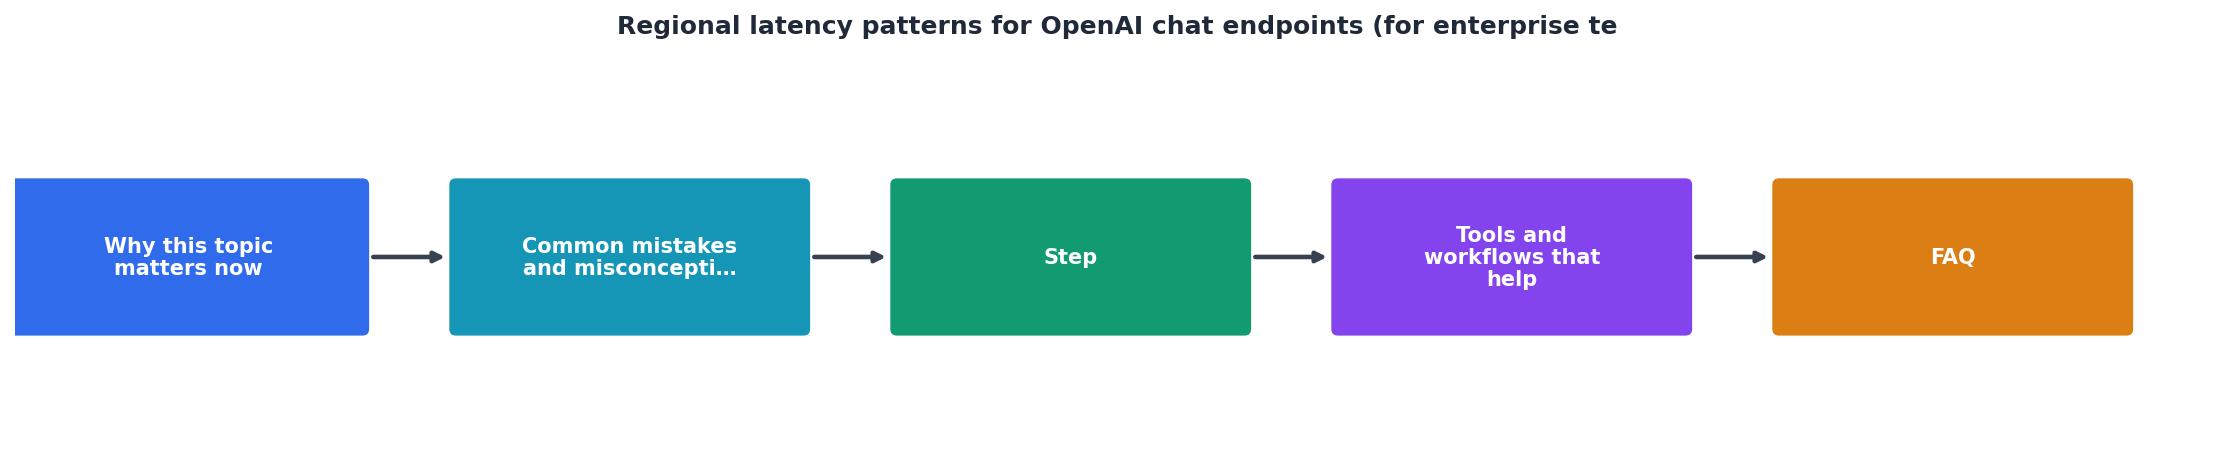
Below is a step-by-step approach to building regional latency visibility into your platform operations. This playbook assumes you already call the OpenAI chat completions API (directly or via a gateway like OpenRouter) and have basic observability in place.
Step 1: Identify your user regions
List every region where you have meaningful user traffic. Do not limit this to cloud regions, think about where end-users physically sit. A product with a "US-only" cloud deployment might still serve users in Latin America or Europe through CDN edges.
Step 2: Establish per-region baselines
For each user region, collect at least two weeks of TTFB and TTFT data. Use synthetic probes that mimic your real workload shape, same model, similar prompt length, similar max-token settings. Record p50, p90, and p99 for each region independently.
Step 3: Define per-region SLOs
Set latency SLOs that reflect actual user expectations, not a single global target. For example:
| Region | TTFB p90 Target | Typical Variance |
|---|---|---|
| US-East / US-West | < 500 ms | Low (±50 ms) |
| EU-West (Frankfurt, London) | < 650 ms | Low-Medium (±80 ms) |
| APAC (Tokyo, Sydney) | < 900 ms | High (±200 ms) |
| South America (São Paulo) | < 1000 ms | High (±250 ms) |
These numbers are illustrative, your actual thresholds should come from your baseline data and product requirements.
Step 4: Configure automated probes and alerts
Run synthetic probes from each target region at regular intervals (daily at minimum, hourly if your SLOs are tight). Configure alerts that fire when a region's latency exceeds its own baseline by a defined percentage, for example, 30% above the trailing 7-day p90. Baseline-relative alerting avoids the false-positive problem of static thresholds in high-variance regions.
Step 5: Build a regional status view
Create an internal (or public) status page that shows per-region latency health at a glance. This is invaluable during incidents: instead of debating whether "the API is slow," your team can immediately see that São Paulo is degraded while Frankfurt is fine. This narrows the investigation scope and reduces MTTR.
Step 6: Review weekly trends
Schedule a weekly review of regional latency trends. Look for:
- Gradual baseline drift (a region getting consistently slower over weeks)
- New variance patterns (a previously stable region becoming erratic)
- Correlation with provider changes (model updates, new API versions)
Checklist: regional latency readiness for enterprise teams

Use this checklist to audit your current monitoring posture:
Your progress is saved automatically in your browser.
Mitigating regional latency: what you can actually control
While you cannot move Azure data centers closer to São Paulo, there are levers enterprise teams can pull:
- Request routing, If you use OpenRouter or a custom gateway, route requests to the provider endpoint geographically closest to the user. Some teams maintain a region-to-endpoint mapping and update it based on probe data.
- Prompt optimization, Shorter prompts and effective use of system-message caching reduce per-request compute time, which disproportionately helps high-latency regions where every millisecond of server-side processing is amplified by network round-trips.
- Streaming vs. non-streaming, Streaming responses improve perceived latency (TTFT) even when total response time is similar. For APAC and South American users, streaming can make the difference between a usable and an unusable experience.
- Multi-provider fallback, Monitor both OpenAI direct and OpenRouter endpoints. When one path degrades in a specific region, automatically fall back to the other. Observinio tracks both providers from all 21 regions, giving you the data to make this decision in near-real-time.
Frequently Asked Questions
Start measuring before your users start complaining
Regional latency patterns are not theoretical, they directly affect user experience, retention, and your team's incident response time. If you are running OpenAI chat endpoints in production for a global user base, per-region monitoring is not optional. Observinio's daily probes from 21 regions, baseline comparison, and email degradation alerts give enterprise platform teams the visibility they need without building a custom synthetic monitoring stack. Check the status page to see current regional data, or get in touch to set up alerts tailored to your SLOs.
Additional Resources
- Severe latency on Azure OpenAI GPT-4o in North Central US - We're seeing severe latency on Azure OpenAI Service GPT-4o deployments in the North Central US region starting around 7:00 AM EST today. Symptoms ...
- Azure OpenAI in Microsoft Foundry Models performance & ... - This article provides you with background around how latency and throughput works with Azure OpenAI and how to optimize your environment to ...
- High latency for chat completion requests to Azure OpenAI ... - I have a deployment of gpt-4o-mini 2024-07-18 in region swedencentral and started to encounter high latency around 7:38 AM GMT on 2025/11/13. The request ...