
Photo by Andrew Neel from Pexels
OpenAI's chat and completion endpoints power millions of production features in 2026, yet their latency profile remains one of the least predictable variables in any ML stack. A request that resolves in 180 ms from us-east-1 can easily take 900 ms from ap-southeast-1, and that gap widens unpredictably during peak hours or model roll-outs. If your QA sign-off process does not include latency validation from the regions your users actually occupy, you are shipping blind.
This guide walks through the metrics that matter, the monitoring architecture that catches regressions before users complain, and a concrete QA checklist you can bolt onto your release pipeline today.
TL;DR
- TTFB and TTFT are the two latency metrics that most directly affect perceived speed of LLM-powered features; track both, not just total request duration.
- Regional variance is real and large. A single aggregate p95 number hides 2–5× differences between continents.
- Synthetic probes from multiple regions are the only reliable way to separate provider-side slowdowns from your own infrastructure issues.
- Baseline comparison beats static thresholds. Alert when latency deviates from a rolling baseline, not when it crosses an arbitrary number.
- QA sign-off should include a latency gate, a defined set of regions and percentile targets that must pass before a release goes live.
Why OpenAI API latency deserves its own monitoring layer

Most APM tools treat external API calls as opaque HTTP spans. They record total duration and status code, then move on. That approach misses three things that are critical for LLM APIs:
- Streaming token delivery. When you use
stream: true, the HTTP response starts quickly, but the time to the first meaningful token (TTFT) and the inter-token interval determine the user experience. A 200 OK with a 4-second TTFT feels broken in a chat UI. - Model-specific variance. Switching from
gpt-4otogpt-4o-minichanges latency characteristics dramatically. Your monitoring must tag by model, not just by endpoint URL. - Provider routing differences. If you call OpenAI through OpenRouter, the routing layer adds its own latency, sometimes negligible, sometimes significant depending on region and load. Observinio tracks both OpenRouter and OpenAI direct endpoints so you can compare apples to apples.
The metrics that matter: TTFB, TTFT, and regional p95
Before you can monitor effectively, you need to agree on what you are measuring. Here are the key latency metrics for OpenAI API calls in production:
Metric definitions
- TTFB (Time to First Byte): The elapsed time from sending the HTTP request to receiving the first byte of the response. This captures DNS, TLS handshake, network transit, and the provider's initial processing time.
- TTFT (Time to First Token): For streaming responses, the time until the first content token arrives. TTFT is always ≥ TTFB, but the gap between them reveals how much overhead the provider's streaming infrastructure adds.
- Total duration: Wall-clock time from request start to the final byte (or the
[DONE]event in a stream). Useful for batch workloads, less useful for interactive chat. - Regional p50 / p95 / p99: Percentile breakdowns per probe region. The p95 is typically the most actionable: it represents the experience of your unluckiest-but-not-outlier users.
"Intuition: Prompt tokens add very little latency to completion calls.">, Production best practices
This insight is important for monitoring design. It means that prompt length is rarely the cause of latency spikes. When you see a sudden jump in TTFB, look at provider-side queuing, network path changes, or model version updates, not at your prompt engineering.
What "good" looks like in 2026
Latency targets depend on your use case, but here are reasonable starting points for interactive chat features using gpt-4o:
| Metric | Target (us-east) | Target (eu-west) | Target (ap-southeast) |
|---|---|---|---|
| TTFB p50 | < 200 ms | < 300 ms | < 450 ms |
| TTFB p95 | < 500 ms | < 700 ms | < 1 000 ms |
| TTFT p50 | < 350 ms | < 500 ms | < 700 ms |
| TTFT p95 | < 800 ms | < 1 100 ms | < 1 500 ms |
Quick comparison: OpenAI Direct vs OpenRouter
| Attribute | OpenAI Direct | OpenRouter |
|---|---|---|
| Typical TTFB overhead | Baseline | +30–80 ms routing layer |
| Regional routing control | Limited | Provider-managed |
| Failover support | Manual | Automatic across providers |
Regional variance: the hidden production risk

OpenAI's inference infrastructure is concentrated in a small number of data center regions. That means a user in São Paulo and a user in Tokyo experience fundamentally different network paths, and therefore fundamentally different latencies, even when the model and prompt are identical.
Why aggregate dashboards lie
If 70 % of your traffic comes from North America and 30 % from Asia-Pacific, your global p95 will be dominated by the North American distribution. A 3× regression in APAC latency might barely move the global number. Meanwhile, your APAC users are watching a spinner for five seconds on every message.
How Observinio solves this
Observinio runs daily synthetic probes from 21 global regions, each hitting both OpenAI direct and OpenRouter endpoints. Every probe records TTFB, TTFT, and total duration, then compares the result against a rolling baseline for that specific region-model-provider combination. When a region deviates beyond a configurable threshold, you get an email alert, not a generic "API is slow" message, but a specific "TTFB p95 for gpt-4o in ap-southeast-1 increased 140 % vs. 7-day baseline" notification.
This region-level granularity is what separates actionable monitoring from noise. You can explore current data on the Observinio status page.
Building a latency-aware QA sign-off process
Most QA pipelines validate functional correctness, does the feature return the right output?, but skip latency validation entirely. Here is a step-by-step process to add a latency gate to your release workflow.
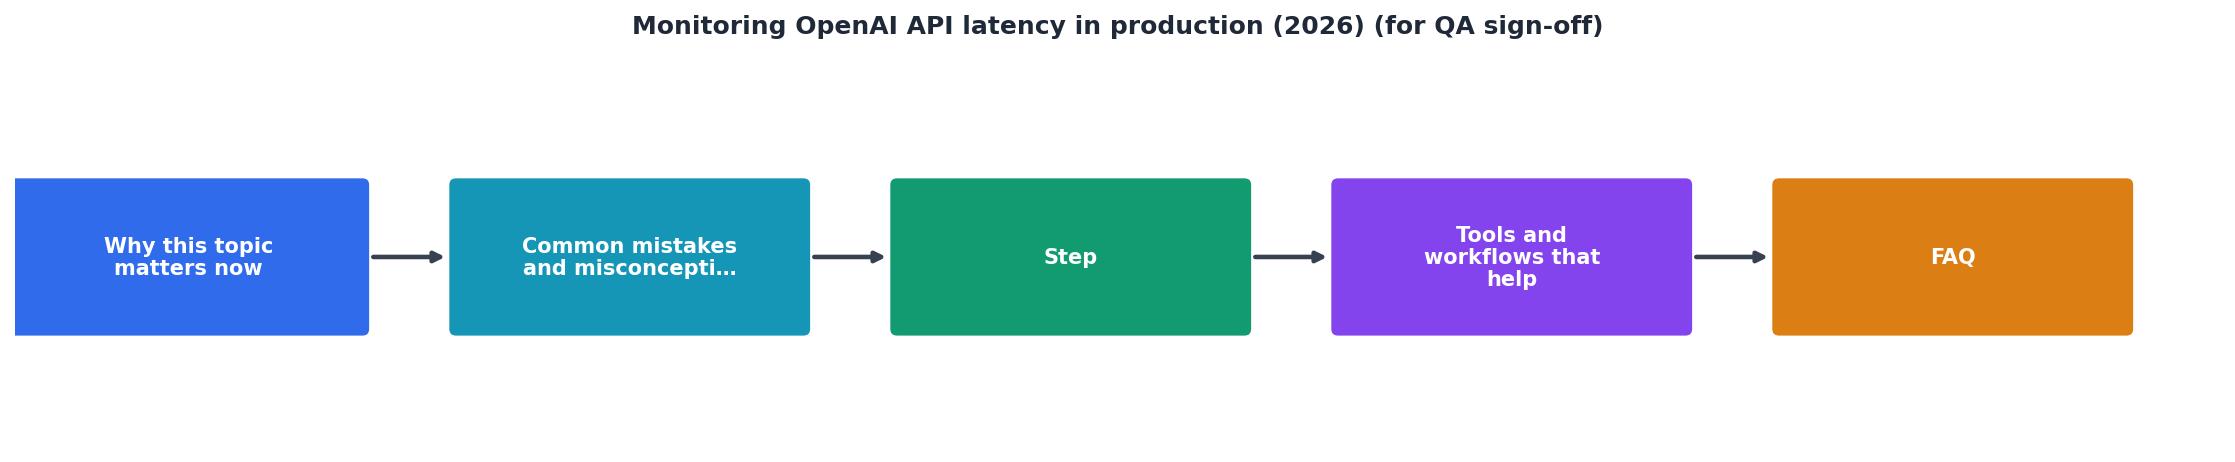
Step-by-step: adding a latency gate to CI/CD
- Define your critical regions. Pick the 3–5 regions where most of your users live. For a typical SaaS product, this might be
us-east-1,eu-west-1,ap-northeast-1, andsa-east-1.
- Establish baselines. Use at least 7 days of probe data to calculate p50 and p95 baselines for each region-model pair. Observinio's weekly summary emails provide exactly this data, or you can pull it from the status page.
- Set pass/fail thresholds. A reasonable starting point: the release passes if current p95 TTFB is within 130 % of the 7-day baseline for all critical regions. Adjust the multiplier based on your tolerance.
- Integrate the check into your pipeline. Add a stage after functional tests that queries your monitoring data. A simple script works:
#!/bin/bash

BASELINE_MS=500
CURRENT_MS=$(curl -s "https://your-monitoring-api/v1/latency?region=us-east-1&model=gpt-4o&percentile=p95" | jq '.ttfb_ms')
THRESHOLD_MS=$((BASELINE_MS  130 / 100))

if [ "$CURRENT_MS" -gt "$THRESHOLD_MS" ]; then
  echo "FAIL: TTFB p95 is ${CURRENT_MS}ms (threshold: ${THRESHOLD_MS}ms)"
  exit 1
fi
echo "PASS: TTFB p95 is ${CURRENT_MS}ms"
- Gate the deployment. If any critical region fails the threshold check, block the release and notify the team. This prevents shipping during a provider degradation that would make your new feature look broken.
- Document exceptions. Sometimes you need to ship despite elevated latency (e.g., the regression is provider-side and outside your control). Log the exception with the current latency numbers so postmortems have data.
QA sign-off checklist
Use this checklist before every production release that touches LLM-powered features:
Your progress is saved automatically in your browser.
Proactive alerting vs. reactive firefighting
The difference between a team that catches latency regressions in minutes and one that discovers them through support tickets comes down to three things:
1. Synthetic probes, not just real-user monitoring
Real-user monitoring (RUM) tells you what happened to actual requests. Synthetic probes tell you what would* happen to a request right now, from a specific region, regardless of whether you have traffic there. Observinio's daily probes from 21 regions give you continuous coverage even in low-traffic regions where RUM data is sparse.
2. Baseline-relative alerts, not static thresholds
A static threshold of "alert if TTFB > 800 ms" will either fire constantly in high-latency regions or never fire in low-latency ones. Baseline-relative alerting, "alert if TTFB exceeds 140 % of the 7-day rolling average for this region", adapts automatically and catches real regressions without drowning you in noise.
3. Weekly trend reports
Day-to-day fluctuations are normal. What matters is the trend. Is TTFB in eu-west-1 creeping up 5 % per week? That is a signal to investigate before it becomes an incident. Observinio's weekly summary emails surface exactly these trends, giving you a regular cadence for latency review without requiring manual dashboard checks.
Common pitfalls when monitoring OpenAI latency
Avoid these mistakes that teams commonly make when setting up LLM API monitoring:
- Monitoring only total duration. Total duration includes output token generation time, which scales with response length. A longer response is not a regression, it is just more tokens. Track TTFB and TTFT separately.
- Ignoring cold-start effects. Some model endpoints exhibit higher latency on the first request after a period of inactivity. Your probes should account for this by running at regular intervals, not just on-demand.
- Treating OpenRouter and direct OpenAI as interchangeable. They have different routing paths, different caching behaviors, and different failure modes. Monitor both if you use both, and keep the data separate. Observinio's provider comparison page makes this straightforward.
- Alerting on p50 instead of p95. The median user experience is important, but the tail is where incidents hide. A p50 that looks fine can mask a p95 that has doubled.
- Not tagging by model. If you switch from
gpt-4otogpt-4o-miniand your monitoring does not distinguish between them, you will misinterpret the latency change as a provider improvement or regression when it is actually a model change.
Key takeaway: Latency monitoring for OpenAI API calls must be region-aware, baseline-relative, and integrated into your QA sign-off pipeline — a single global p95 number hides the regressions that hurt your users most.
FAQ
Frequently Asked Questions
gpt-4o from a US-based probe, a p95 TTFB under 500 ms is achievable under normal conditions. European probes typically see 200–300 ms higher, and APAC probes 300–500 ms higher. Use your own baseline data rather than adopting someone else's targets, your traffic patterns and prompt profiles are unique.Start monitoring before the next incident
If your current QA process does not include a latency gate, the next OpenAI API slowdown will reach your users before it reaches your dashboard. Observinio's daily probes from 21 regions, baseline-relative degradation alerts, and weekly summary emails give you the data layer you need to catch regressions early and sign off on releases with confidence. Set up alerts on the Observinio status page and make latency a first-class part of your QA workflow, your on-call rotation will thank you.
Additional Resources
- Production best practices | OpenAI API - API key usage can be monitored on the Usage page once tracking is enabled. You can enable tracking going forward on the API key management dashboard.
- Approaches for monitoring quality of reasoning capabilities ... - Approaches for monitoring quality of reasoning capabilities in production - over a period of 15-25 minutes, OpenAI have a tool that may be of use for this in ...
- LLM Monitoring Best Practices: Complete Guide for 2026 - This guide covers the most important LLM monitoring best practices for teams running models in production whether you're using OpenAI, Anthropic ...