
Photo by Саша Алалыкин from Pexels
Migrations are the most dangerous time for latency. Whether you are moving from one OpenAI model version to another, switching from a direct OpenAI endpoint to OpenRouter, or consolidating multiple providers behind a single gateway, the transition window is exactly when latency regressions slip through unnoticed. In 2026, with OpenAI rolling out new model families and deprecating older ones on tighter schedules, production teams face more migration events per quarter than ever before. This guide explains how to monitor OpenAI API latency throughout every phase of a migration project so you catch degradation before your users do.
TL;DR
- Migration projects (model upgrades, provider switches, gateway consolidation) introduce latency risk that aggregate dashboards hide.
- Measure TTFB (Time to First Byte) and TTFT (Time to First Token) from multiple regions before, during, and after every migration step.
- Establish per-region baselines at least two weeks before the migration cutover date.
- Use synthetic probes, not just real-user monitoring, to isolate provider-side latency from your own stack.
- Set up degradation alerts with tight thresholds during the migration window, then relax them once the new baseline stabilizes.
Why migrations are a latency blind spot
Most teams monitor latency in steady state. Dashboards show p50, p95, and p99 aggregated across all regions and all traffic. That works fine when nothing changes. During a migration, however, the picture fractures. Half your traffic may still hit the old endpoint while the other half routes to the new one. Regional rollouts mean that users in Frankfurt see the new model while users in Tokyo still hit the legacy path. Aggregate numbers average these two populations together, masking a regression that affects only one group.
Consider a concrete scenario: you are migrating from gpt-4o to a newer gpt-4o-2026-08 checkpoint. The new checkpoint may have different inference characteristics, slightly higher TTFT due to a larger context window default, or lower TTFB because of improved batching on OpenAI's side. If you only watch a single global p95 number, a 120 ms TTFT increase in eu-west-1 gets diluted by unchanged latency in us-east-1 where most of your traffic originates. The regression ships, and European users start complaining two days later.
The fix is straightforward but requires discipline: segment your monitoring by migration phase, by region, and by endpoint version.
Establishing pre-migration baselines
A baseline is only useful if it is recent, regional, and representative. Here is how to build one that actually helps during migration.
What to measure
- TTFB (Time to First Byte): The interval from sending the HTTP request to receiving the first byte of the response. This captures DNS, TLS, TCP, and server processing time. It tells you how fast the provider acknowledges your request.
- TTFT (Time to First Token): For streaming completions, the time from request dispatch to the first token arriving. This is the metric your users feel, it is the "thinking" delay before text starts appearing.
- Total completion time: End-to-end wall-clock time for the full response. Important for non-streaming use cases and batch pipelines.
- Regional variance: The difference in any of the above metrics across geographic probe locations. A 40 ms TTFB from Virginia and a 210 ms TTFB from Mumbai is not unusual, but you need to know the spread before migration so you can detect when it widens.
How long to collect
Two weeks of daily probes gives you enough data to account for weekday/weekend patterns and OpenAI's own maintenance windows. If your migration timeline is shorter, one week is the absolute minimum. Observinio's daily probes from 21 regions collect exactly this kind of baseline automatically, you get a per-region, per-provider history without writing any custom instrumentation.
Baseline checklist
Your progress is saved automatically in your browser.
Planning the migration monitoring strategy

A migration project typically moves through three phases: canary, progressive rollout, and full cutover. Each phase needs its own monitoring posture.
Phase 1, Canary (1–5 % of traffic)
Route a small slice of traffic to the new endpoint. At this stage you are looking for catastrophic regressions, TTFT doubling, error rates spiking, or specific regions timing out entirely. Set alert thresholds at 1.5× the baseline p95 for TTFB and TTFT. Because traffic volume is low, synthetic probes are critical here: they give you consistent signal even when real-user sample sizes are too small to be statistically meaningful.
Phase 2, Progressive rollout (5–50 %)
Increase traffic in steps (5 %, 10 %, 25 %, 50 %). At each step, compare the new endpoint's regional latency against the baseline. Watch for load-dependent regressions: some latency issues only appear when the provider's inference cluster receives more concurrent requests from your account. Tighten alert thresholds to 1.3× baseline p95 during this phase.
Phase 3, Full cutover (100 %)
All traffic now hits the new endpoint. Keep the old endpoint's probes running for at least one week so you have a rollback comparison point. Relax alert thresholds back to 1.5× baseline, but now the baseline is the new endpoint's stabilized numbers from Phase 2.
"Intuition: Prompt tokens add very little latency to completion calls.">, Production best practices
This insight matters during migrations because teams often change prompt templates alongside model versions. If your new prompt is significantly longer but TTFT barely moves, that is expected behavior, not a sign that monitoring is broken. Conversely, if TTFT jumps despite a similar prompt length, the regression is real and worth investigating.
Step-by-step: setting up migration-aware monitoring
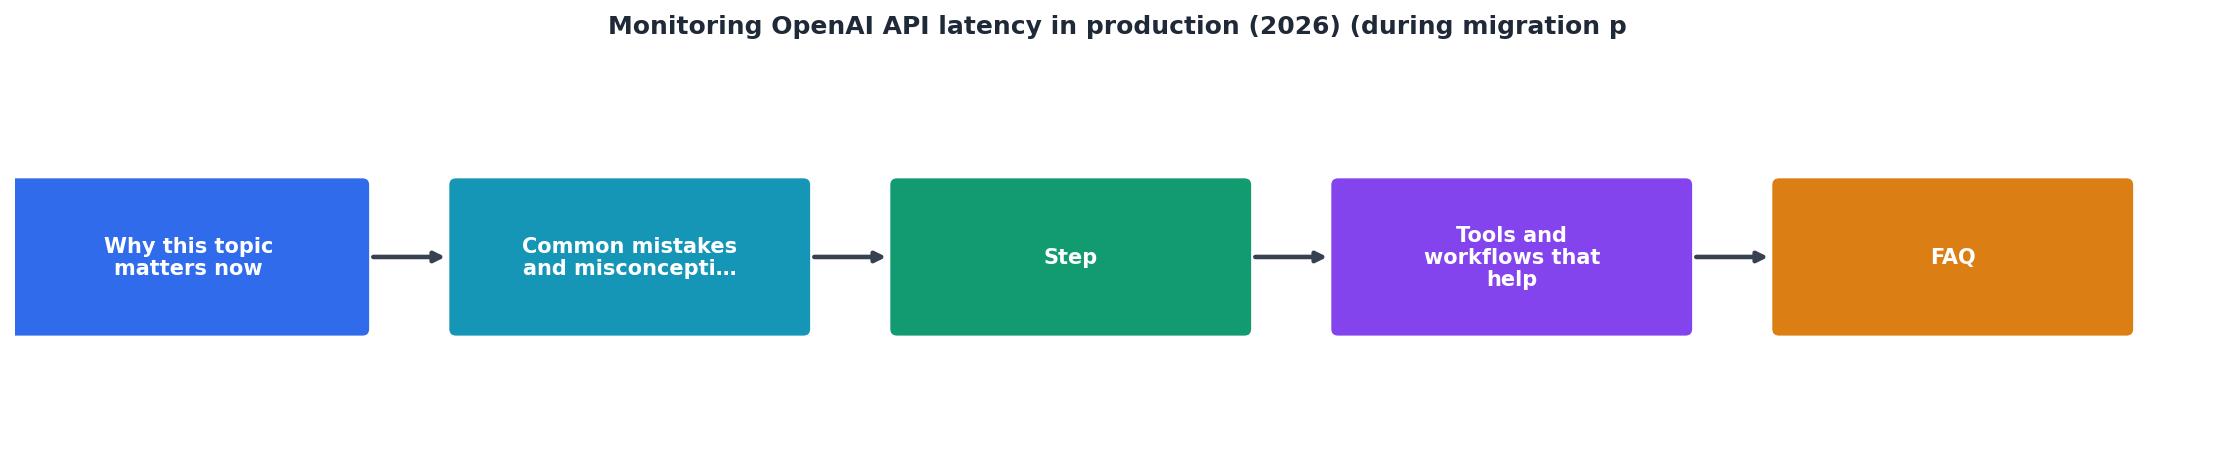
Follow these steps to instrument your migration from start to finish:
- Tag traffic by migration phase. Add a metadata label (
migration_phase: canary | rollout | cutover) to every request log. This lets you filter dashboards and alerts by phase after the fact. - Deploy synthetic probes for both old and new endpoints. Run identical probe payloads against both targets from the same set of regions. Observinio lets you configure probes for OpenAI direct and OpenRouter endpoints side by side, so you get an apples-to-apples comparison without building custom scripts.
- Set per-region alert thresholds. Do not use a single global threshold. A 200 ms TTFT threshold that works for
us-east-1will fire constantly fromap-southeast-1where the baseline is already 280 ms. Derive each region's threshold from its own baseline. - Create a migration dashboard. Include these panels at minimum:
- TTFB p50/p95 by region, split by old vs. new endpoint.
- TTFT p50/p95 by region, split by old vs. new endpoint.
- Error rate by endpoint.
- Traffic split percentage (canary vs. production).
- Schedule daily reviews. During the migration window, review the dashboard every morning. Look for slow regional drift, a 10 ms/day TTFT increase that does not trigger alerts but compounds over a week.
- Run a post-migration soak test. After full cutover, keep both probe sets active for at least seven days. Compare the new endpoint's week-over-week trend against the old endpoint's final baseline. Only decommission the old probes once the new numbers are stable.
Common migration latency pitfalls

Teams that have been through multiple OpenAI migration cycles report the same recurring issues. Knowing them in advance saves hours of incident debugging.
- Cold-start spikes after cutover. When you shift 100 % of traffic to a new model version, the provider's inference infrastructure may not have your request pattern cached. Expect elevated TTFT for the first 30–60 minutes. Do not roll back prematurely, wait for the spike to settle and compare against the baseline trend, not the first few data points.
- Regional routing changes you did not request. OpenAI and OpenRouter occasionally update their internal routing. A migration that coincides with a provider-side routing change can produce confusing data. Synthetic probes from fixed regions help you isolate whether the latency shift is on your side or theirs.
- Prompt template drift. Migration projects often bundle prompt changes with model changes. If TTFT increases, you need to determine whether the cause is the new model, the new prompt, or both. Run probes with a fixed, minimal prompt to isolate model-level latency from prompt-level latency.
- Timeout configuration mismatch. Older models may have had generous timeout settings that mask slow responses. When you migrate to a new endpoint, verify that your HTTP client timeouts, retry policies, and streaming chunk timeouts are appropriate for the new model's latency profile.
- Forgetting non-primary regions. Teams focus monitoring on their highest-traffic region and neglect secondary ones. A migration that works perfectly in Virginia but adds 300 ms in São Paulo will not show up in your top-line metrics until Brazilian users churn. Multi-region probes are not optional during migrations.
Key takeaway: Segment your latency monitoring by migration phase, by region, and by endpoint version — aggregate dashboards hide regressions that affect only a subset of your users, and catching those regressions early is the difference between a smooth migration and a multi-day incident.
Building a migration latency runbook
Every migration project should have a runbook that the on-call engineer can follow without context-switching to Slack threads. Here is a template:
| Severity | TTFT Delta vs Baseline | Action |
|---|---|---|
| Low | < 15 % | Monitor for 30 minutes, no escalation needed |
| Medium | 15–25 % | Notify migration lead, hold current traffic split |
| High | > 25 % | Roll back to previous phase, capture probe snapshot for postmortem |
- Trigger: Alert fires for TTFB or TTFT exceeding threshold on the new endpoint in any region.
- Step 1: Check the Observinio status page to determine if the provider is experiencing a global or regional incident.
- Step 2: Compare the alerting region's current TTFT against its pre-migration baseline. If the delta is less than 20 %, monitor for 15 minutes before escalating.
- Step 3: If the delta exceeds 20 %, check whether the old endpoint shows similar degradation. If yes, the issue is provider-wide, not migration-related.
- Step 4: If only the new endpoint is degraded, reduce traffic split to the previous phase (e.g., from 50 % back to 25 %) and notify the migration lead.
- Step 5: After rollback, capture a snapshot of TTFB and TTFT from all 21 probe regions for the postmortem.
Frequently Asked Questions
Start monitoring before you migrate
If you have a migration on the roadmap, model upgrade, provider switch, or gateway consolidation, the worst time to set up latency monitoring is the day of cutover. Observinio's daily probes from 21 global regions give you the pre-migration baselines, per-region alerting, and weekly summary emails you need to migrate with confidence. Check the status page to see current provider latency, or get in touch to set up degradation alerts before your next migration window opens.
Additional Resources
- Production best practices | OpenAI API - Explore best practices for transitioning your AI projects from prototype to production, including scaling, security, and cost management.
- Serious latency issues while migrating from GPT-4o - API - API. 7, 1607, February 10, 2026. How to reduce response latency in Azure OpenAI GPT-3.5/GPT-4 API or find a better-performing model? Community.
- A Practical Guide to LLM Workload Migration - Verify that your existing client code works against the OpenAI-compatible endpoint with only URL and API key changes, then re-run your latency benchmarks to confirm performance parity.