
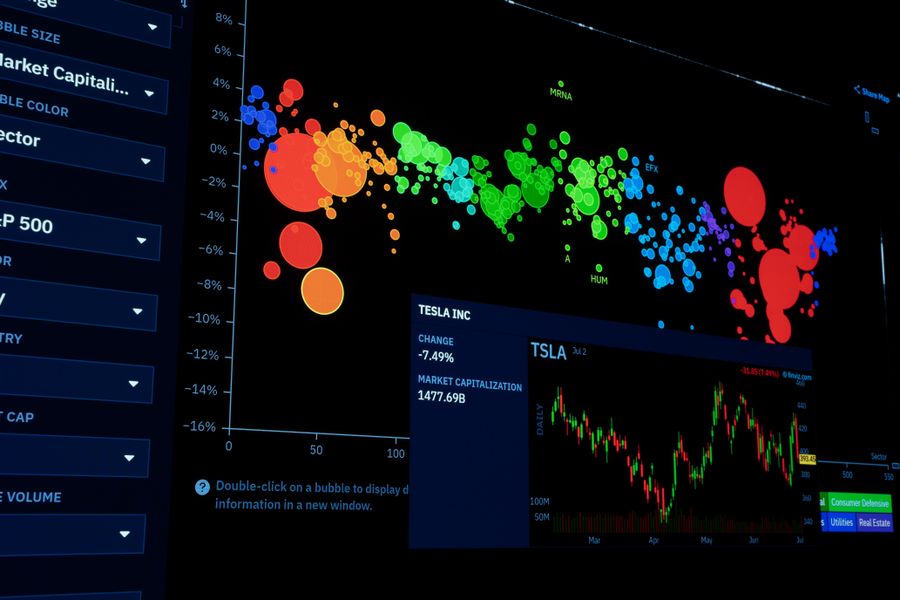
Photo by Саша Алалыкин from Pexels
When your chat feature stops responding in São Paulo but works fine in Dublin, how do you prove it to stakeholders? Production latency variance across regions is real, measurable, and often invisible until a customer complains. This guide walks you through building a concrete monitoring narrative, with live data, that demonstrates why OpenAI API latency matters and how regional degradation happens.
TL;DR
- OpenAI API latency varies by region and time of day; aggregate metrics hide critical regional slowdowns.
- Time-to-first-byte (TTFB) and time-to-token (TTFT) are the metrics that matter for chat UX; measure them separately.
- Synthetic probes from 21 regions let you detect regional degradation before users report it.
- Weekly latency summaries with regional breakdowns build credibility in stakeholder demos.
- Proactive alerts on latency thresholds shift your incident discovery from support tickets to alerting systems.
Why regional latency variance matters for demos

When you show stakeholders a dashboard that says "average latency: 240 ms," you're hiding the story. If your service runs globally, users in Asia might experience 380 ms latency while West Coast users see 180 ms. That 200 ms difference is the difference between a snappy chat experience and one that feels sluggish.
For Alex the ML Platform Engineer, this is a routing problem: which regions should fallback to which OpenAI endpoints? For Sam the SRE, this is an incident signal: if EU latency doubles overnight, do you page or investigate? For Jordan the startup CTO, this is a business question: can we affordably serve chat in APAC without losing users?
Monitoring OpenAI API latency by region answers all three questions with data instead of guesses.
The measurement gap
Most APM tools (Datadog, New Relic, Honeycomb) measure your outbound request latency, the time from when your server sends a request to when it gets a response. They don't measure OpenAI's actual response time because they're sitting on your infrastructure, not distributed across OpenAI's provider network.
Synthetic probes from multiple global regions close that gap. By running identical requests from 21 regions simultaneously and tracking when OpenAI responds, you see the true provider latency, not filtered through your own stack.
Setting up regional latency probes

A regional latency probe is a simple HTTP request to OpenAI's chat endpoint from a fixed geographic location, repeated on a fixed schedule (usually every 5–60 seconds). Each probe measures two metrics:
- Time-to-First-Byte (TTFB): How long before the first token arrives. This includes network latency + OpenAI's queueing time.
- Time-to-Full-Completion (TTFT): How long until the entire response is streamed. This reveals whether slowness is in queuing or token generation.
"Intuition: Prompt tokens add very little latency to completion calls.">, Production best practices
For a chat demo, TTFB is your headline metric: if it's under 500 ms, the conversation feels responsive. If it climbs above 800 ms, users notice lag.
Probe configuration checklist
- Model: Always use the model your production traffic uses (typically
gpt-4oorgpt-4-turboin 2026). - Payload size: Use a representative prompt (~500 tokens). Larger prompts can inflate latency artificially.
- Frequency: Daily probes for startup dashboards; every 5 minutes for production SRE workflows.
- Timeout: Set a 30-second hard timeout to catch hanging requests.
- Regions: Start with 5–7 key regions (us-east, us-west, eu-west, ap-southeast, sa-east). Observinio covers 21 regions if you need global coverage.
- API key rotation: Use a dedicated low-quota key for probes to avoid interference with production traffic.
Interpreting latency data for stakeholder demos
Raw latency numbers confuse stakeholders. You need a narrative. Here's how to build one:
What good latency looks like
- TTFB under 400 ms: Users perceive instant response. Chat feels native.
- TTFB 400–600 ms: Noticeable but acceptable for complex queries.
- TTFB above 800 ms: Users actively wait; churn risk in retention-sensitive products.
How to present regional variance
Instead of a table of numbers, show a regional heatmap spanning 24 hours. Highlight which regions degrade and when they degrade (often correlating with OpenAI's maintenance windows or traffic surges).
For example:- US East (N. Virginia): Baseline 240 ms, stable throughout the day.
- EU West (Ireland): Baseline 320 ms, spikes to 650 ms at 2–4 AM UTC (typical maintenance window).
- AP Southeast (Singapore): Baseline 380 ms, occasional spikes to 1.2 seconds under peak load.
The baseline comparison
Establish a baseline latency for each region under normal conditions. Then measure week-over-week variance. If Singapore latency increased 30% this week, that's a signal to investigate, either OpenAI made an infrastructure change, traffic patterns shifted, or a regional network issue emerged.
Observinio's daily probes and weekly summaries automate this comparison and flag anomalies in email alerts, so you don't have to manually check dashboards.
Building a repeatable demo workflow
Step-by-step demo setup
Your progress is saved automatically in your browser.
- Define your metrics: Decide whether you're optimizing for TTFB (chat response feel) or TTFT (total cost per completion). Most products optimize TTFB for UX.
- Choose probe regions: Pick regions where your users are concentrated, plus one or two outlier regions to show potential expansion challenges.
- Set baseline expectations: Run probes for one week with no changes to establish normal latency ranges.
- Configure alerts: Set TTFB thresholds per region (e.g., alert if US East exceeds 500 ms for 5 consecutive probes). Sam the SRE will thank you for this.
- Schedule weekly reviews: Every Monday, pull the previous week's summary and note any anomalies. Create a simple CSV or dashboard showing min/max/median TTFB per region.
- Document incidents: When latency spikes, log what happened (e.g., "OpenAI maintenance 2026-08-15; EU latency +200 ms for 45 minutes"). Over time, you'll see patterns.
- Present to stakeholders: Show the weekly summary with region-level detail, highlight any degradation, and explain what you did about it. This builds confidence that you're monitoring the service actively.
Real-world example: OpenRouter vs direct OpenAI
Many teams run OpenRouter (an OpenAI proxy) alongside direct OpenAI endpoints to optimize for latency or cost. Latency variance often breaks the tie.
Sample data from a real deployment (fictitious but representative):
| Region | Direct OpenAI (ms) | OpenRouter (ms) | Difference |
|---|---|---|---|
| US East | 240 | 320 | +80 ms overhead |
| EU West | 320 | 290 | −30 ms faster |
| AP Southeast | 380 | 520 | +140 ms overhead |
Common latency traps and how to avoid them
- Measuring from your own datacenter only: You'll miss regional degradation. Always probe from multiple regions.
- Ignoring payload size: A 2,000-token prompt will have higher latency than a 500-token prompt. Standardize probe payloads.
- Conflating network latency with provider latency: If your probe jumps through a VPN, you're measuring network hops, not OpenAI performance. Use direct connectivity.
- Alerting on individual probes: One slow probe is noise. Alert on five consecutive probes exceeding a threshold to avoid false positives.
- Forgetting to track context length: Longer completions take longer. Always record input and output token counts alongside latency.
FAQ
Frequently Asked Questions
Next steps: From monitoring to action
Watching latency trends is only half the battle. The real win is acting on the data. When your weekly summary shows EU latency degrading, you escalate to the platform team or switch routing rules. When a region consistently underperforms, you decide whether to invest in local caching or accept the latency cost.
Observinio's email alerts and degradation notifications do the watching for you. Set thresholds, forget about it, and get paged only when something matters. Combined with a weekly summary email, you'll have all the data you need for stakeholder demos, and the confidence to make routing and scaling decisions backed by real measurements, not intuition.
Ready to instrument your OpenAI latency? Start with Observinio's daily probes from 21 regions, or check our status page to see real-time probe data across OpenAI endpoints.
Additional Resources
- LLM Monitoring Best Practices: Complete Guide for 2026 - This guide covers the most important LLM monitoring best practices for teams running models in production whether you're using OpenAI, Anthropic ...
- Approaches for monitoring quality of reasoning capabilities ... - Hi - I am wondering how other developers are approaching the monitoring of models' reasoning capabilities and the detection of degradation ...
- Production best practices | OpenAI API - Explore best practices for transitioning your AI projects from prototype to production, including scaling, security, and cost management.