
Photo by Саша Алалыкин from Pexels
Default latency benchmarks for OpenAI models are measured with a single, generic prompt. Your production traffic looks nothing like that. If your application sends 50-token classification prompts in Tokyo and 2,000-token summarization prompts in Frankfurt, a single global average tells you almost nothing about the experience your users actually have. Custom token sets, carefully chosen prompt and completion sizes that mirror your real workloads, turn vague "the API feels slow" complaints into actionable, region-specific latency data you can act on before users notice.
TL;DR
- Generic benchmarks hide the latency your actual prompts experience because token count, prompt shape, and region all shift response times.
- Custom token sets let you define probe payloads that match your production workloads, short classification, medium RAG, long summarization, so every measurement is relevant.
- Time to First Byte (TTFB) and Time to First Token (TTFT) behave differently as prompt size grows; monitoring both is essential.
- Running probes from multiple regions (Observinio covers 21) exposes routing-layer variance that aggregate dashboards miss entirely.
- Automated degradation alerts tied to per-token-set baselines cut Mean Time to Detect (MTTD) from hours to minutes.
Why generic latency numbers mislead production teams

Most public latency reports for OpenAI endpoints use a short "Hello, how are you?" style prompt and measure the round-trip time for a handful of completion tokens. That number is useful for comparing models on a level playing field, but it is a poor proxy for what happens when your inference pipeline sends a 1,800-token document through gpt-4o and expects a 400-token structured JSON response.
Three factors make generic numbers unreliable for production decisions:
- Prompt token count affects prefill time. The model must process every input token before it emits the first output token. A 50-token prompt and a 2,000-token prompt can differ by hundreds of milliseconds in TTFT alone, depending on current load and model version.
- Completion length determines total streaming duration. If you measure only TTFB, you miss the tail: a 500-token completion at 60 tokens per second adds over eight seconds of streaming time that never appears in a TTFB chart.
- Regional routing changes the baseline. OpenAI's load balancer may route a request from
ap-northeast-1to a different cluster than one fromeu-west-1. The same prompt can show 200 ms of variance purely from geography and network path.
"Intuition: Prompt tokens add very little latency to completion calls.">, Production best practices
That statement holds for short prompts, but once you cross into thousands of input tokens, common in RAG pipelines and document processing, prefill time becomes a measurable contributor. The only way to know where the threshold matters for your workload is to measure it with your actual token sizes.
What custom token sets are and why they matter
A custom token set is a predefined probe payload with a specific prompt length (in tokens) and a target completion length. Instead of sending one generic probe, you define a set of payloads that represent the distinct workloads your application handles.
Typical token set definitions
| Token set name | Prompt tokens | Max completion tokens | Represents |
|---|---|---|---|
classify-short |
60 | 15 | Intent classification, sentiment |
rag-medium |
800 | 200 | Retrieval-augmented generation |
summarize-long |
2,000 | 400 | Document summarization |
chat-multi-turn |
1,200 | 150 | Multi-turn conversation context |
Each token set produces its own latency baseline. When you compare today's summarize-long P95 TTFT against last week's baseline, you are comparing apples to apples. A spike in the summarize-long set that does not appear in classify-short immediately tells you the issue is prefill-related or load-dependent on longer contexts, not a global API degradation.
Key metrics to capture per token set
- TTFB (Time to First Byte): How long until the HTTP response starts streaming. Includes DNS, TLS, and server processing.
- TTFT (Time to First Token): How long until the first decoded token arrives in the SSE stream. This is the metric users "feel" in a chat UI.
- Total completion time: Wall-clock time from request sent to final token received.
- Tokens per second (TPS): Throughput once streaming begins. Useful for detecting throttling mid-stream.
Setting up custom token set monitoring: step by step
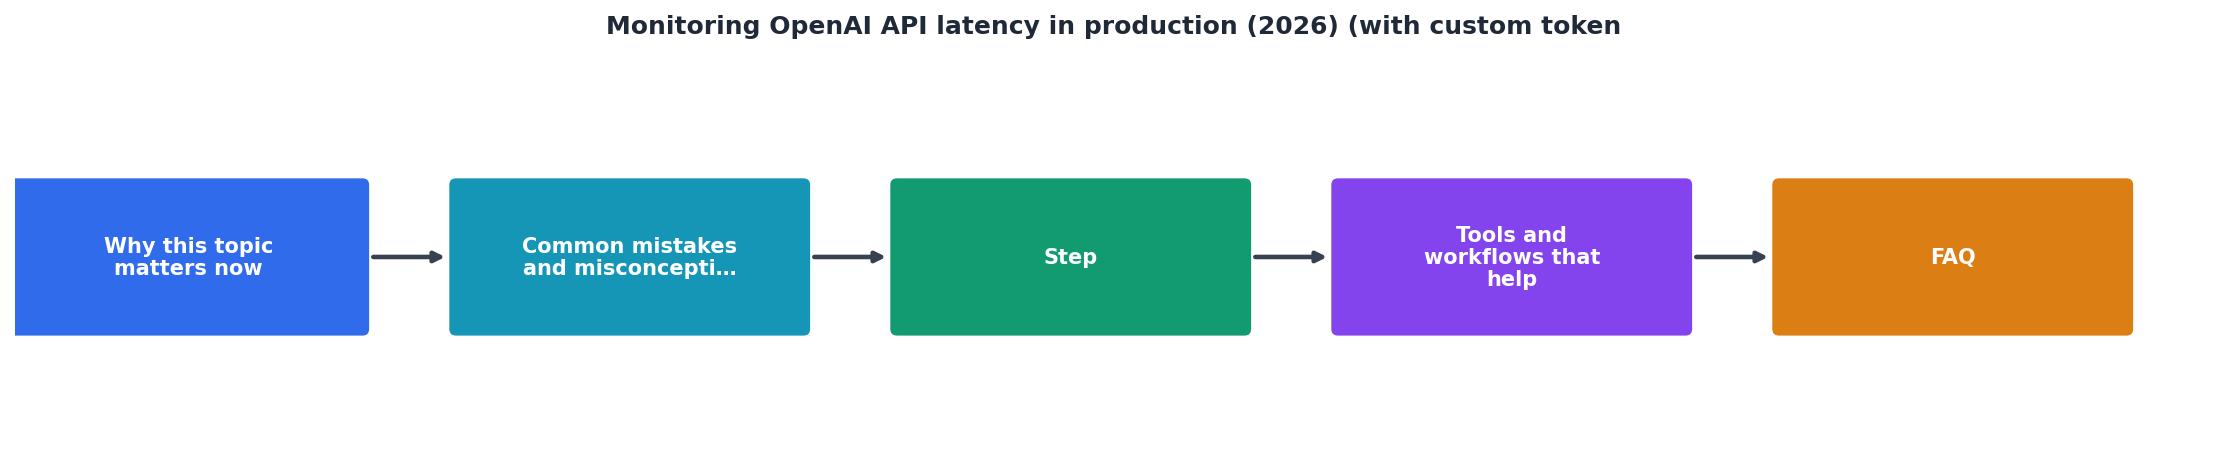
Follow these steps to go from zero to production-grade latency visibility with custom token sets.
- Audit your production traffic. Pull a sample of recent API calls and bucket them by prompt token count. Most applications cluster around two to four distinct sizes. Log the
usage.prompt_tokensandusage.completion_tokensfields from OpenAI responses for a week to get a representative distribution.
- Define your token sets. For each cluster, create a named token set with a representative prompt and a
max_tokensvalue matching your typical completion length. Use deterministic prompts (e.g., a fixed passage plus a fixed instruction) so results are comparable across runs. Avoid random content that could trigger different model behaviors.
- Choose probe regions. Select the regions where your users actually are. If 70 % of your traffic originates in North America and 20 % in Europe, prioritize
us-east-1,us-west-2,eu-west-1, andeu-central-1. Observinio runs daily probes from 21 regions automatically, so you can enable the ones that match your user base without deploying any infrastructure.
- Establish baselines. Run each token set from each region for at least seven days before setting alert thresholds. This captures weekday/weekend variance and any regular maintenance windows. Record P50, P90, and P95 for TTFT and total completion time.
- Configure degradation alerts. Set alerts when a token set's P95 TTFT exceeds its baseline by more than a defined percentage, 20 % is a reasonable starting point for most workloads. Observinio's email alerts can be scoped per region and per probe type, so a
summarize-longspike inap-southeast-1does not wake up the team responsible for US traffic.
- Review weekly summaries. Latency trends matter as much as point-in-time spikes. A gradual 50 ms increase in
rag-mediumTTFT over three weeks might indicate a model update or increased provider load. Weekly summary emails from Observinio surface these slow-moving regressions that real-time dashboards often hide.
Regional variance: the hidden latency multiplier

Even with the same token set, latency from São Paulo and latency from Virginia can differ dramatically. This is not just network round-trip time, OpenAI's infrastructure routes requests to different clusters based on load, and those clusters may have different queue depths at any given moment.
Custom token sets amplify the value of multi-region monitoring because they let you isolate the variable. If classify-short shows 120 ms TTFT from both eu-west-1 and ap-northeast-1, but summarize-long shows 380 ms from eu-west-1 and 620 ms from ap-northeast-1, you know the Asia-Pacific path has a prefill penalty that only manifests at higher token counts. That insight is invisible in a single-region, single-prompt monitoring setup.
Practical implications for routing decisions
- Latency-based model routing: If
summarize-longconsistently exceeds your SLO from a specific region, you can route those requests through a different provider or a different OpenAI endpoint (e.g., via OpenRouter) that performs better for that region and payload size. - Failover thresholds per workload: A 200 ms TTFT increase on
classify-shortmight be tolerable, but the same absolute increase onchat-multi-turn, where users are staring at a loading spinner, is not. Custom token sets let you set workload-appropriate failover thresholds. - Capacity planning: Tracking TPS per token set per region over time gives you a leading indicator of when a provider is approaching capacity limits for your workload profile.
Key takeaway: Custom token sets transform latency monitoring from a single misleading average into a multi-dimensional view that matches your real workloads, enabling faster detection, smarter routing, and workload-specific SLOs that protect the user experiences that matter most.
Integrating custom token set data into your ops workflow

Latency data is only useful if it reaches the right people at the right time. Here is a checklist for integrating custom token set monitoring into your existing operations:
Your progress is saved automatically in your browser.
Example: detecting a silent regression
Consider a scenario where OpenAI rolls out an infrastructure change that increases prefill time for prompts above 1,500 tokens by 15 %. Your classify-short and rag-medium probes show no change. Your summarize-long probe in eu-central-1 crosses its P95 alert threshold on Tuesday morning. The on-call engineer checks the Observinio dashboard, confirms the regression is isolated to long-context probes in European regions, and opens a support ticket with OpenAI, complete with timestamped latency data from a neutral third-party monitor. Without custom token sets, this regression would have been buried in an aggregate average and discovered only when users complained about slow document summaries days later.
Frequently Asked Questions
Start monitoring with the token sets that match your workload
If you are still relying on generic latency numbers to judge OpenAI API performance, you are flying partially blind. Observinio lets you track TTFT and total completion time from 21 global regions with daily probes and automated degradation alerts, so you can define token sets that mirror your real traffic and get notified the moment latency drifts outside your baseline. Check the status page for current provider performance, or visit the contact page to set up alerts tailored to your workloads.
Additional Resources
- Production best practices | OpenAI API - Lower max tokens: for requests with a similar token generation count, those that have a lower max_tokens parameter incur less latency. · Include stop sequences: ...
- Monitor OpenAI API Costs with OpenTelemetry - Learn how to monitor OpenAI API costs and track LLM token usage. Latency tells you how long users waited. Prices in USD per 1 million tokens, as of April 2026.
- Latency optimization | OpenAI API - This guide covers the core set of principles you can apply to improve latency across a wide variety of LLM-related use cases.