
Photo by Andrew Neel from Pexels
Accessibility audits in 2026 increasingly evaluate perceived performance, and that includes the time users spend waiting for AI-generated content to appear on screen. If your product relies on OpenAI's chat or completion endpoints to render alt text, summarize documents, or power assistive features, latency is no longer just an engineering metric; it is an accessibility metric. This guide walks through exactly how to monitor OpenAI API latency in production with accessibility audit requirements in mind, which numbers matter, and how to set up proactive alerting so regressions never reach your users first.
TL;DR
- Accessibility audits now flag slow AI-generated content (alt text, summaries, captions) as a usability barrier, TTFB and TTFT above 2–3 seconds can fail perceived-performance criteria.
- Monitoring must be regional: a model that responds in 400 ms from
us-east-1may take 1 200 ms fromap-southeast-1, directly impacting users in that geography. - Synthetic probes running on a fixed schedule (e.g., every 30 minutes from 21 regions) give you a stable baseline that is independent of your own traffic patterns.
- Set degradation alerts at the P95 level, not the average, accessibility failures happen at the tail.
- Observinio's daily probes, baseline comparison, and email alerts cover all of the above without custom infrastructure.
Why accessibility audits care about API latency
Accessibility standards like WCAG 2.2 emphasize that content must be "perceivable" and "operable" in a timely manner. When AI-generated content, think dynamically produced image descriptions, real-time captions, or plain-language summaries, takes too long to load, screen-reader users experience dead air. Keyboard-only users may tab into an empty container that fills seconds later, breaking focus management. Audit tools such as Lighthouse and axe-core already penalize long Time to Interactive (TTI) values; in 2026, specialized accessibility audit firms are explicitly calling out AI-dependent content that loads more than two seconds after the surrounding page.
The root cause is almost always upstream latency: the time between your server sending a request to OpenAI and receiving the first usable token (TTFT) or the full response. If that number drifts upward, because of model updates, regional routing changes, or capacity constraints, your accessibility posture degrades silently. You will not see it in your error-rate dashboards because the requests still succeed; they just succeed slowly.
Key latency metrics for OpenAI endpoints
Before you instrument anything, agree on which numbers you are tracking. Not every latency metric is equally relevant for accessibility.
Metric definitions
- TTFB (Time to First Byte), elapsed time from the moment your HTTP request leaves the client to the moment the first byte of the response arrives. This includes DNS, TLS handshake, and server processing. For streaming endpoints, TTFB is your earliest signal that the model is alive.
- TTFT (Time to First Token), the time until the first meaningful token appears in a streamed completion. TTFT is typically a few hundred milliseconds after TTFB because the initial bytes are often HTTP headers or SSE framing. For accessibility, TTFT is the number that maps to "when does the user's assistive technology start receiving content?"
- Total response time, wall-clock time from request to the final token. Relevant for non-streaming calls or when you buffer the full response before rendering (common for alt-text generation).
- P50 / P95 / P99 percentiles, averages hide tail latency. A P50 of 600 ms with a P95 of 3 200 ms means one in twenty requests will fail a two-second accessibility threshold.
- Regional variance, the delta between the fastest and slowest region for the same model and prompt. Variance above 500 ms usually indicates routing asymmetry or capacity imbalance at the provider level.
"Intuition: Prompt tokens add very little latency to completion calls.">, Production best practices
This means your monitoring should focus on output-token generation time and network path, not prompt size. A 2 000-token prompt and a 200-token prompt will have similar TTFT values; the difference shows up in total response time proportional to the number of completion tokens generated.
Setting up regional synthetic probes
Relying on real-user monitoring (RUM) alone is insufficient for accessibility audits. Auditors want to see that you proactively measure latency, not that you reactively discovered a problem after a user complained. Synthetic probes solve this by sending a standardized request on a fixed schedule from known locations.
What a good probe looks like
A synthetic probe for OpenAI latency monitoring should have these properties:
- Fixed prompt and parameters, use the same
model,max_tokens,temperature, and prompt text every time so that results are comparable across days and regions. - Streaming enabled, record both TTFT (first SSE
data:chunk with a non-emptycontentdelta) and total response time. - Multiple regions, at minimum, cover the geographies where your users are. Observinio runs probes from 21 regions, which gives you coverage across North America, Europe, Asia-Pacific, South America, and the Middle East.
- Consistent schedule, daily probes establish a baseline; more frequent probes (every 30 minutes) catch intra-day variance.
Example probe script (Python)
import time
import openai

client = openai.OpenAI()

start = time.perf_counter()
first_token_time = None

stream = client.chat.completions.create(
    model="gpt-4o",
    messages=[
        {"role": "user", "content": "Describe this image for a screen reader in one sentence."}
    ],
    max_tokens=60,
    temperature=0,
    stream=True,
)

for chunk in stream:
    if first_token_time is None and chunk.choices[0].delta.content:
        first_token_time = time.perf_counter()

end = time.perf_counter()

ttft_ms = (first_token_time - start)  1000 if first_token_time else None
total_ms = (end - start)  1000

print(f"TTFT: {ttft_ms:.0f} ms | Total: {total_ms:.0f} ms")
This script is intentionally minimal. In production you would wrap it in a scheduled task, tag results with the region identifier, and push metrics to your observability backend, or simply let Observinio handle all of that automatically.
Step-by-step: connecting latency monitoring to your accessibility audit workflow
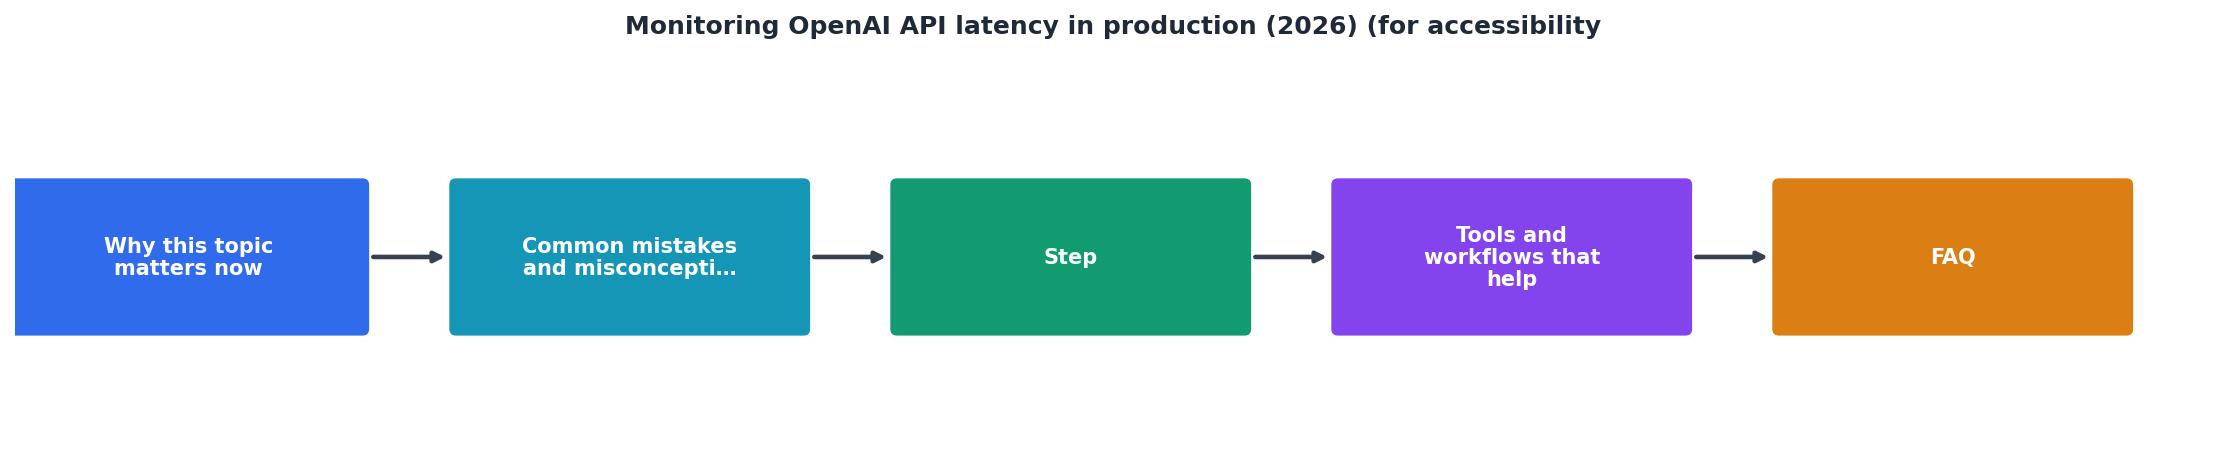
Follow these steps to build a monitoring pipeline that directly feeds into accessibility audit evidence:
- Identify AI-dependent accessibility features. List every place your product uses an OpenAI call to generate content consumed by assistive technology: dynamic alt text, document summaries, chat-based navigation, real-time captions, etc.
- Define latency SLOs per feature. For each feature, set a maximum acceptable TTFT and total response time. A reasonable starting point for screen-reader-facing content is TTFT ≤ 1 000 ms and total ≤ 3 000 ms at P95.
- Deploy synthetic probes in every user region. If you serve users in Europe and Asia-Pacific, you need probes in at least
eu-west-1,eu-central-1,ap-southeast-1, andap-northeast-1. Observinio's 21-region grid covers this out of the box. - Establish a baseline over 14 days. Collect probe data for two weeks before drawing conclusions. This accounts for weekly traffic patterns at the provider level and any scheduled model updates.
- Configure degradation alerts. Set alerts to fire when P95 latency exceeds your SLO for two consecutive probe cycles. This avoids false positives from single transient spikes. Observinio's email alerts support exactly this threshold-based approach.
- Generate weekly summary reports. Accessibility auditors want documentation. Export or screenshot your weekly latency summary showing per-region P50 and P95 trends. Observinio sends these summaries automatically every Monday.
- Include latency evidence in your VPAT or audit response. When an auditor asks "How do you ensure AI-generated alt text loads in a timely manner?", you hand them the weekly report, the SLO definition, and the alert configuration. This is concrete, defensible evidence.
Interpreting regional variance for accessibility

Regional variance is the single most overlooked factor in accessibility-related latency failures. A model that comfortably meets your 1 000 ms TTFT SLO from US-East may blow past 2 500 ms from Southeast Asia. If your accessibility audit is conducted from a single geography, you might pass with flying colors while users in another region experience unacceptable delays.
Common patterns to watch for
- Consistent regional offset. If
ap-southeast-1is always 600 ms slower thanus-east-1, the cause is likely network distance to OpenAI's inference cluster. Mitigation: consider a caching layer for deterministic prompts (e.g., alt text for the same image hash) or route through a closer provider endpoint. - Intermittent regional spikes. If
eu-west-1is normally fast but spikes to 4 000 ms every Tuesday afternoon, you may be hitting a capacity boundary during peak European business hours. Mitigation: set tighter alerts for that region and have a fallback model or provider ready. - Global degradation. If all 21 regions degrade simultaneously, the issue is at the provider's inference layer, not the network. Mitigation: this is where Observinio's status page becomes valuable, you can confirm the degradation is provider-wide and communicate accordingly to your accessibility team.
Checklist: regional latency readiness for accessibility audits
Your progress is saved automatically in your browser.
Choosing between OpenAI direct and OpenRouter
When latency is an accessibility concern, the routing layer matters. OpenAI's direct API and OpenRouter both reach the same underlying models, but the network path differs. Observinio monitors both OpenAI direct and OpenRouter endpoints, so you can compare TTFT and total response time side by side from the same region.
Key considerations:
- OpenAI direct typically has lower TTFT because there is no intermediary proxy. For latency-critical accessibility features (live captions, real-time alt text), direct access is usually the safer choice.
- OpenRouter adds a routing hop but offers model fallback and load balancing across providers. If your accessibility feature can tolerate an extra 100–200 ms of TTFT, the resilience benefit may be worth it.
- Test both from your users' regions. Do not assume one is universally faster. Observinio's baseline comparison lets you see the actual delta per region per model, updated daily.
| Criteria | OpenAI Direct | OpenRouter |
|---|---|---|
| Typical TTFT overhead | Baseline (0 ms added) | +100–200 ms |
| Model fallback support | No | Yes |
| Best for latency-critical a11y features | Recommended | Acceptable with tolerance |
| Resilience under provider outage | Single point of failure | Automatic rerouting |
Frequently Asked Questions
Key takeaway: OpenAI API latency is now an accessibility metric, not just an engineering metric. Monitor TTFT and total response time at the P95 level from every region where your users rely on AI-generated accessible content, set threshold-based alerts, and archive weekly reports so you have defensible evidence ready for every audit cycle.
Start monitoring before the next audit
If your product ships AI-powered accessibility features, alt text, summaries, captions, or any content that assistive technology depends on, latency monitoring is no longer optional. Observinio gives you daily probes from 21 regions, automatic baseline comparison, P95 degradation alerts, and weekly summary emails that double as audit evidence. Set up your first alert on the Observinio status page and have defensible latency data ready before your next accessibility review.
Additional Resources
- Production best practices | OpenAI API - This guide provides a comprehensive set of best practices to help you transition from prototype to production, covering latency optimization and rate-limit management.
- OpenAI rate limit monitoring, now with an 80% throttling alert - Elastic's OpenAI integration now polls rate limits every five minutes and checks them against real usage across every project and model.
- Implement Advanced Monitoring for Foundry Models - Monitoring workloads that include Azure OpenAI in Foundry Models can be as simple as enabling diagnostics for Azure OpenAI and using preconfigured dashboards.