
Photo by Andrew Neel from Pexels
Server-side rendering changed the latency equation for every team that calls OpenAI from a backend. When your Next.js, Nuxt, or SvelteKit server fetches a chat completion before the page reaches the browser, the OpenAI response time is no longer hidden behind a loading spinner, it lands directly on your Time to First Byte. In 2026, with SSR the default for most AI-powered web apps, monitoring that latency is not optional; it is the critical path to a usable product. This guide walks through exactly what to measure, where the variance hides, and how to set up proactive alerting so you catch degradation before your users do.
TL;DR
- SSR moves OpenAI API latency onto the critical rendering path, every millisecond of TTFT adds to your page's TTFB.
- Regional variance is significant: the same
gpt-4.1call can differ by 300–600 ms between US-East and Southeast Asia. - Synthetic probes from multiple regions are the only reliable way to separate provider slowdowns from your own infrastructure issues.
- Baseline comparison (not just raw numbers) is what turns noisy metrics into actionable alerts.
- A weekly latency summary email saves hours of dashboard-staring and keeps stakeholders informed without meetings.
Why SSR makes OpenAI latency your problem
Before SSR became the dominant pattern, most teams called OpenAI from the client or from a thin API route that streamed tokens back. The user saw a spinner, tokens appeared incrementally, and perceived performance was "good enough." With SSR enabled, the flow changes fundamentally:
- The browser requests a page.
- Your server calls OpenAI (or OpenRouter) to generate content for that page.
- The server waits for the full completion (or at least the first chunk in streaming mode) before it can flush HTML.
- Only then does the browser receive its first byte.
gpt-4.1 call with a moderate prompt, that can easily add 800–2 000 ms on top of your normal server processing. On a bad day, or from a distant region, it can exceed 4 seconds, pushing your Core Web Vitals into the red and triggering user abandonment.
The practical consequence: you need to monitor OpenAI latency with the same rigor you apply to your database queries or CDN hit rates. Aggregate averages are not enough. You need per-region, per-model, time-series data with alerting on deviation from a known baseline.
What to measure: the metrics that matter for SSR workloads

Not every latency number tells the same story. Here are the specific metrics you should track when OpenAI calls sit on your SSR critical path:
Time to First Token (TTFT)
TTFT measures how long it takes from sending the request until the first token arrives in the response stream. For SSR, this is the metric that most directly impacts your page TTFB. If you are using streaming mode and flushing partial HTML as tokens arrive, TTFT determines when the browser starts receiving data.
Total completion time
The wall-clock time from request sent to final token received. Even if you stream, your SSR framework may need the full response before it can render a component (for example, when the completion feeds into a React Server Component that must be serialized whole).
Regional round-trip overhead
Network latency between your SSR server's region and OpenAI's inference endpoints. If your servers run in eu-west-1 but OpenAI's fastest endpoint is in the US, you are paying a 70–120 ms network tax on every request before inference even begins.
Error rate and timeout frequency
A timed-out OpenAI call in an SSR context does not just mean a failed API call, it means a failed page load. Track the percentage of requests that exceed your timeout threshold (typically 5–10 seconds for SSR) and the raw HTTP error rate (429s, 500s, 503s).
Baseline deviation
Raw numbers fluctuate. What matters is whether today's P50 and P95 are meaningfully worse than your rolling 7-day baseline. A TTFT of 1 200 ms might be normal for gpt-4.1 with a 4 000-token prompt, but if your baseline is 800 ms, that 50% increase deserves investigation.
Regional variance: the hidden SSR latency multiplier

One of the most under-appreciated factors in production OpenAI latency is geography. OpenAI's inference infrastructure is not uniformly distributed, and the region your SSR server runs in has a direct, measurable impact on every request.
Consider a typical scenario: your application is deployed on Vercel or AWS with edge functions in multiple regions. A user in Tokyo triggers an SSR page. Your edge function in ap-northeast-1 calls OpenAI. The request travels to OpenAI's US-based inference cluster, waits for processing, and the response travels back. That geographic round-trip alone can add 150–250 ms compared to a server in us-east-1.
Now multiply that by the reality that SSR pages often make two or three OpenAI calls (one for the main content, one for metadata, one for personalization). Suddenly your Tokyo users are experiencing 500–750 ms more latency than your New York users, purely from network geography.
This is why monitoring from a single region gives you a dangerously incomplete picture. Observinio runs daily probes from 21 global regions, which means you can see exactly how OpenAI latency behaves from ap-southeast-1, eu-central-1, sa-east-1, and everywhere in between. When a degradation is regional rather than global, the multi-region data makes that immediately obvious, saving you from chasing phantom issues in your own stack.
Step-by-step: setting up production-grade OpenAI latency monitoring for SSR
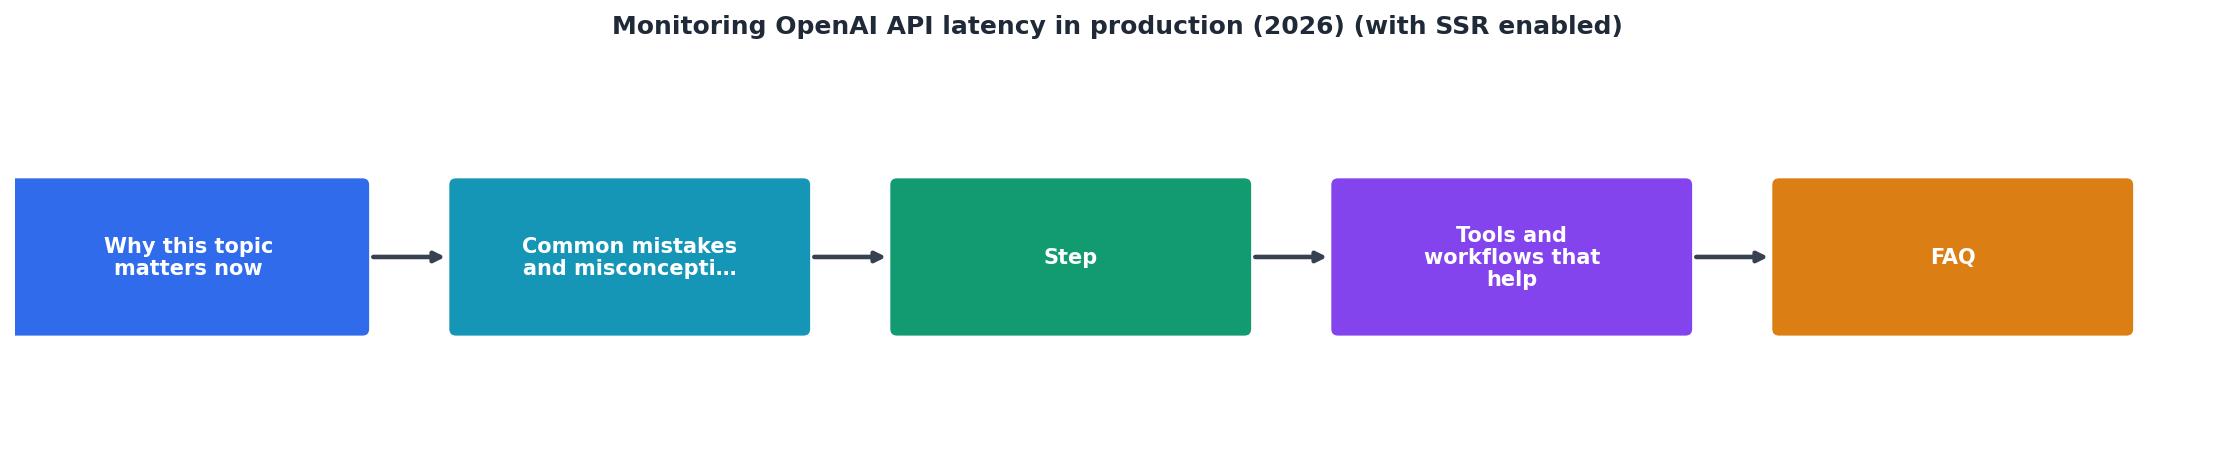
Follow these steps to go from zero visibility to proactive alerting:
Step 1: Instrument your SSR OpenAI calls
Add timing instrumentation around every OpenAI call in your server-side rendering path. Here is a minimal example for a Next.js App Router server component:
// lib/openai-instrumented.ts
import OpenAI from "openai";

const client = new OpenAI();

export async function completionWithTiming(
  params: OpenAI.ChatCompletionCreateParams
) {
  const start = performance.now();
  let ttft: number | null = null;

if (params.stream) {
    const stream = await client.chat.completions.create({
      ...params,
      stream: true,
    });
    const chunks: string[] = [];
    for await (const chunk of stream) {
      if (ttft === null) ttft = performance.now() - start;
      const content = chunk.choices[0]?.delta?.content;
      if (content) chunks.push(content);
    }
    const total = performance.now() - start;
    console.log(
      JSON.stringify({
        model: params.model,
        ttft_ms: ttft?.toFixed(1),
        total_ms: total.toFixed(1),
      })
    );
    return chunks.join("");
  }

const response = await client.chat.completions.create(params);
  const total = performance.now() - start;
  console.log(
    JSON.stringify({
      model: params.model,
      total_ms: total.toFixed(1),
    })
  );
  return response.choices[0]?.message?.content ?? "";
}
This gives you per-request TTFT and total completion time in structured logs. Ship these to your existing log aggregator (Datadog, Grafana Loki, even CloudWatch) for dashboarding.
Step 2: Add external synthetic probes
Internal instrumentation tells you what your users experienced. Synthetic probes tell you what OpenAI's API is doing right now, independent of your traffic patterns. This distinction matters because SSR traffic is bursty, you might not have requests from every region at every hour.
Set up synthetic monitoring that calls the same OpenAI models you use in production, from the same regions your users are in. Observinio does this automatically: daily probes from 21 regions against both OpenAI direct and OpenRouter endpoints, with results compared against rolling baselines.
Step 3: Define your latency budget
Work backwards from your target page TTFB. For example:
- Target page TTFB: 2 000 ms
- Server processing (non-AI): 200 ms
- Available for OpenAI: 1 800 ms
- Safety margin (20%): 360 ms
- OpenAI latency budget: 1 440 ms
TTFB Budget Breakdown
| Component | Time (ms) | Share |
| Server processing (non-AI) | 200 | 10% |
| OpenAI latency budget | 1 440 | 72% |
| Safety margin (20%) | 360 | 18% |
If your P95 TTFT exceeds 1 440 ms, your SSR pages will miss their TTFB target more than 5% of the time. Set your alert threshold at this number.
Step 4: Configure degradation alerts
Threshold-based alerts on raw latency are noisy. A better approach is baseline-relative alerting: trigger when the current P50 or P95 exceeds the 7-day rolling baseline by more than a defined percentage (30–50% is a reasonable starting point).
Observinio's degradation alerts work exactly this way, comparing each probe result against the established baseline for that model, region, and endpoint. When latency drifts beyond the threshold, you get an email alert with the specific region, model, and magnitude of the deviation.
Step 5: Establish a weekly review cadence
Set up a weekly latency summary that shows trends across all regions and models. This catches slow-burn degradation that does not trigger acute alerts, for example, a model that gets 50 ms slower each week after a provider update. Observinio's weekly summary emails are designed for exactly this use case: a single email your team can review in Monday standup.
Checklist: production-ready OpenAI latency monitoring for SSR apps
Use this checklist to audit your current setup:
Your progress is saved automatically in your browser.
Common pitfalls to avoid
- Monitoring only from one region. If your servers are multi-region but your probes are single-region, you will miss regional degradation entirely. This is the most common blind spot.
- Ignoring TTFT in favor of total time. For streaming SSR, TTFT is what determines when the browser starts receiving data. Total time matters less if you can flush partial HTML.
- Setting static alert thresholds. OpenAI latency varies by model, prompt length, and time of day. A static threshold of "alert if > 2 s" will either fire constantly or miss real degradation. Use baseline-relative alerting.
- Not accounting for cold starts. If your SSR runs on serverless (Lambda, Vercel Functions), the first request after a cold start includes function initialization time. Separate cold-start latency from OpenAI latency in your metrics.
- Treating OpenRouter and direct OpenAI as interchangeable. They have different routing, different caching behaviors, and different regional performance profiles. Monitor each path separately. Observinio tracks both OpenRouter and OpenAI direct endpoints so you can compare them side by side.
Frequently Asked Questions
gpt-4.1 class models. This variance is primarily network latency, not inference time, which means it is consistent and predictable, but it will not improve unless OpenAI expands its inference infrastructure to more regions. Check the Observinio status page for current regional breakdowns.gpt-4.1 with moderate prompt sizes (under 4 000 tokens). Smaller models like gpt-4.1-mini or gpt-4.1-nano typically deliver TTFT under 500 ms, which gives you much more headroom. If your latency budget is tighter, consider pre-computing completions at build time or using edge caching for repeated prompts.Key takeaway: SSR puts OpenAI latency squarely on the critical rendering path, so you must monitor it per-region with baseline-relative alerting rather than static thresholds. Combine internal instrumentation with external synthetic probes to distinguish provider slowdowns from your own infrastructure issues, and use weekly summary reports to catch slow-burn degradation before it impacts your users.
Start monitoring before the next incident
If your SSR application depends on OpenAI, you are one regional degradation away from a page-load crisis that your current monitoring will not catch. Observinio's multi-region probes, baseline-relative degradation alerts, and weekly summary emails give you the external visibility layer that internal instrumentation alone cannot provide. Check the live status page to see how OpenAI and OpenRouter are performing right now across 21 regions, and set up alerts so the next slowdown hits your inbox before it hits your users.